Nielsen Guides Campaigns to What Voters Watch

The smarter way to stay on top of broadcasting and cable industry. Sign up below
You are now subscribed
Your newsletter sign-up was successful
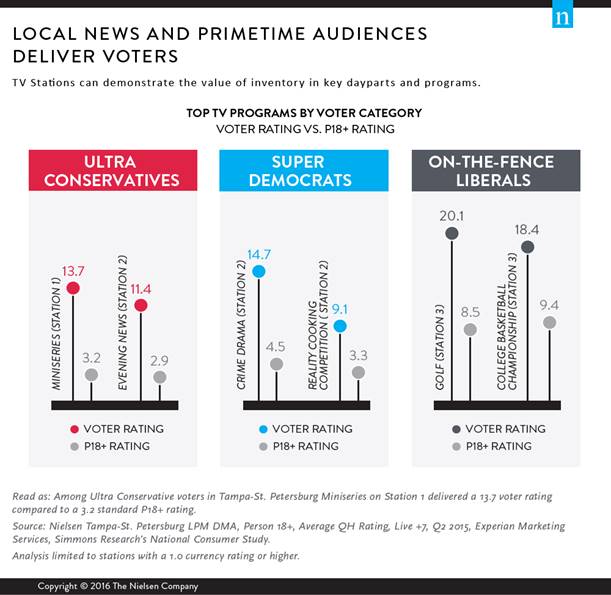
Political candidates looking to reach ultra conservative voters in the Tampa-St.Petersburg, Fla., market might want to buy ads in miniseries. Or if it’s Democrats they want to turn out, a crime drama would work. Golf is a surprisingly good place to reach on-the fence liberals.
This information comes from Nielsen’s voter ratings, which can help candidates and media outlets customize ad buys that reach voters not based just on age and gender, but by how they vote.
Carol Edwards, Nielsen’s senior VP of media analytics, says the product is useful because it is closely aligned with the Nielsen currency ratings media outlets, media buyers and campaigns are familiar with.
Sinclair Broadcasting and Katz Radio Group have signed on for the product. Clients pay Nielsen extra for the political data.
Campaign agencies use this type of information as part of their media planning and buying process. The competitiveness of the political process drives anonymity among who’s using the data, Edwards said.
A recent study by Nielsen explored how identifying the right dayparts and programs in local markets can effectively reach voters across the political spectrum. It segmented viewers as Super Democrats, Ultra Conservatives, On-The-Fence Liberals, Conservative Democrats, Left-Out Democrats, Mild Republicans, Uninvolved Conservatives and Green Traditionalists. Nielsen matched TV viewing data from second-quarter 2015 with voter segmentation data in the Cleveland, Denver and Tampa-St. Petersburg markets.

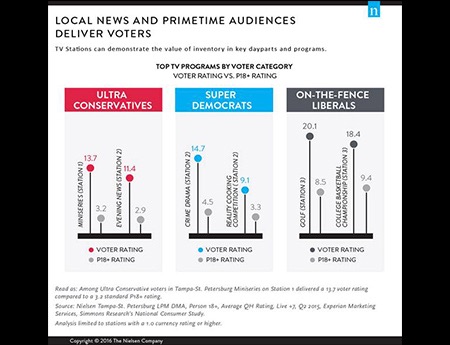
In Tampa, for example, Nielsen found that while a miniseries that aired on one station drew a 3.2 rating among adults 18 and up, it had a 13.7 rating among Ultra Conservatives. On that station, the evening news had a 2.9 rating among all viewers and an 11.4 rating with those Ultra Conservatives.
The smarter way to stay on top of broadcasting and cable industry. Sign up below
At another station in Tampa, a crime drama that pulled a 4.5 rating drew a 14.7 voter rating with Super Democrats. A third Tampa station saw golf programming draw a 20.1 voter rating among On-The-Fence Liberals, compared to an 8.5 rating overall.
Looking in the pivotal state of Ohio, Nielsen found that Cleveland cable viewer with strong political beliefs were tuning into home improvement reality shows. Super Democrat female viewers 30 years and older were 47% more likely to watch home reality shows, while Ultra Conservatives were 38% more likely to be tuned into home improvement.
During the last presidential campaign President Obama used big data to identify cable programming watched by targeted voters, rather than simply airing spots in local news programming. The strategy proved to be successful and data from Rentak was given credit.
RELATED: comScore-Rentrak Merger Gets Shareholder Approval
Edwards says Nielsen’s product is different because it is based on the Nielsen currency ratings, but she added that “our data acts as a compliment to any tool anyone’s using in the market.”
Jon has been business editor of Broadcasting+Cable since 2010. He focuses on revenue-generating activities, including advertising and distribution, as well as executive intrigue and merger and acquisition activity. Just about any story is fair game, if a dollar sign can make its way into the article. Before B+C, Jon covered the industry for TVWeek, Cable World, Electronic Media, Advertising Age and The New York Post. A native New Yorker, Jon is hiding in plain sight in the suburbs of Chicago.

