What Advertisers Can Learn from March Madness 2021
Key takeaways from a delayed tourney as TV ramps back up for sports‘ return
The smarter way to stay on top of broadcasting and cable industry. Sign up below
You are now subscribed
Your newsletter sign-up was successful

The marquee matchup between Gonzaga and Baylor provided a fitting end to an exciting March Madness tournament. As the two teams strived to create history (Gonzaga chasing a 32-0 perfect season and Baylor looking for the elusive national championship crown), TV networks and online sports books were creating milestones of their own.
After a break year, March Madness, the 68-team NCAA Division I Men’s College Basketball Tournament, is back with a bang. TV ratings during the early rounds of this year's tournament saw historical jumps compared to the 2019 season. Viewership for the regional semifinals was up 12% compared to the Sweet 16 round in 2019. The 2021 regional semifinals averaged 12.9 million viewers across TBS and CBS delivering the best Sweet 16 viewership since 1993, while TBS and truTV accounted for a gross viewership of 7.6 million viewers during the first four rounds, the highest recorded viewership for the tournament’s early stages ever.
And, while critics may point at double-digit declines during the Elite 8 games held during the work week, the resurgence in sports viewership among U.S. audiences should be putting a smile on the face of advertisers looking to use live sports as part of their media plans this year.
The tournament might be over, but it has left some learnings for marketers in its wake as we head into a new action-packed sports season. Here are some of the key takeaways for marketers from this year’s tournament.
47M Americans Placed Their Bets
The American Gaming Association (AGA) predicted that more than 47 million, or 18%, Americans planned to wager on the NCAA tournament this year, with a 206% increase in the number of people looking to place the bet online.
The dramatic growth in sport betting popularity could be attributed to the expansion of the legal market, as 73.6 million more Americans in 14 new legal jurisdictions could safely place bets on March Madness this year compared to the 2019 tournament. A 180% increase in online activity across betting domains in North Carolina (where betting was legalized March 18) compared to the 2019 season was a clear testament to this as well.
A higher interest in online betting has further translated into increased activity around college basketball content online, with audiences across all age groups reviewing stats from the historical college basketball season. Young sports enthusiasts (18-to-34-year-olds) were 1.63 times more likely to conduct thorough online research before making a wager. The betting audiences with bigger bankrolls were also comparatively more likely to follow college basketball this year than before.
The smarter way to stay on top of broadcasting and cable industry. Sign up below
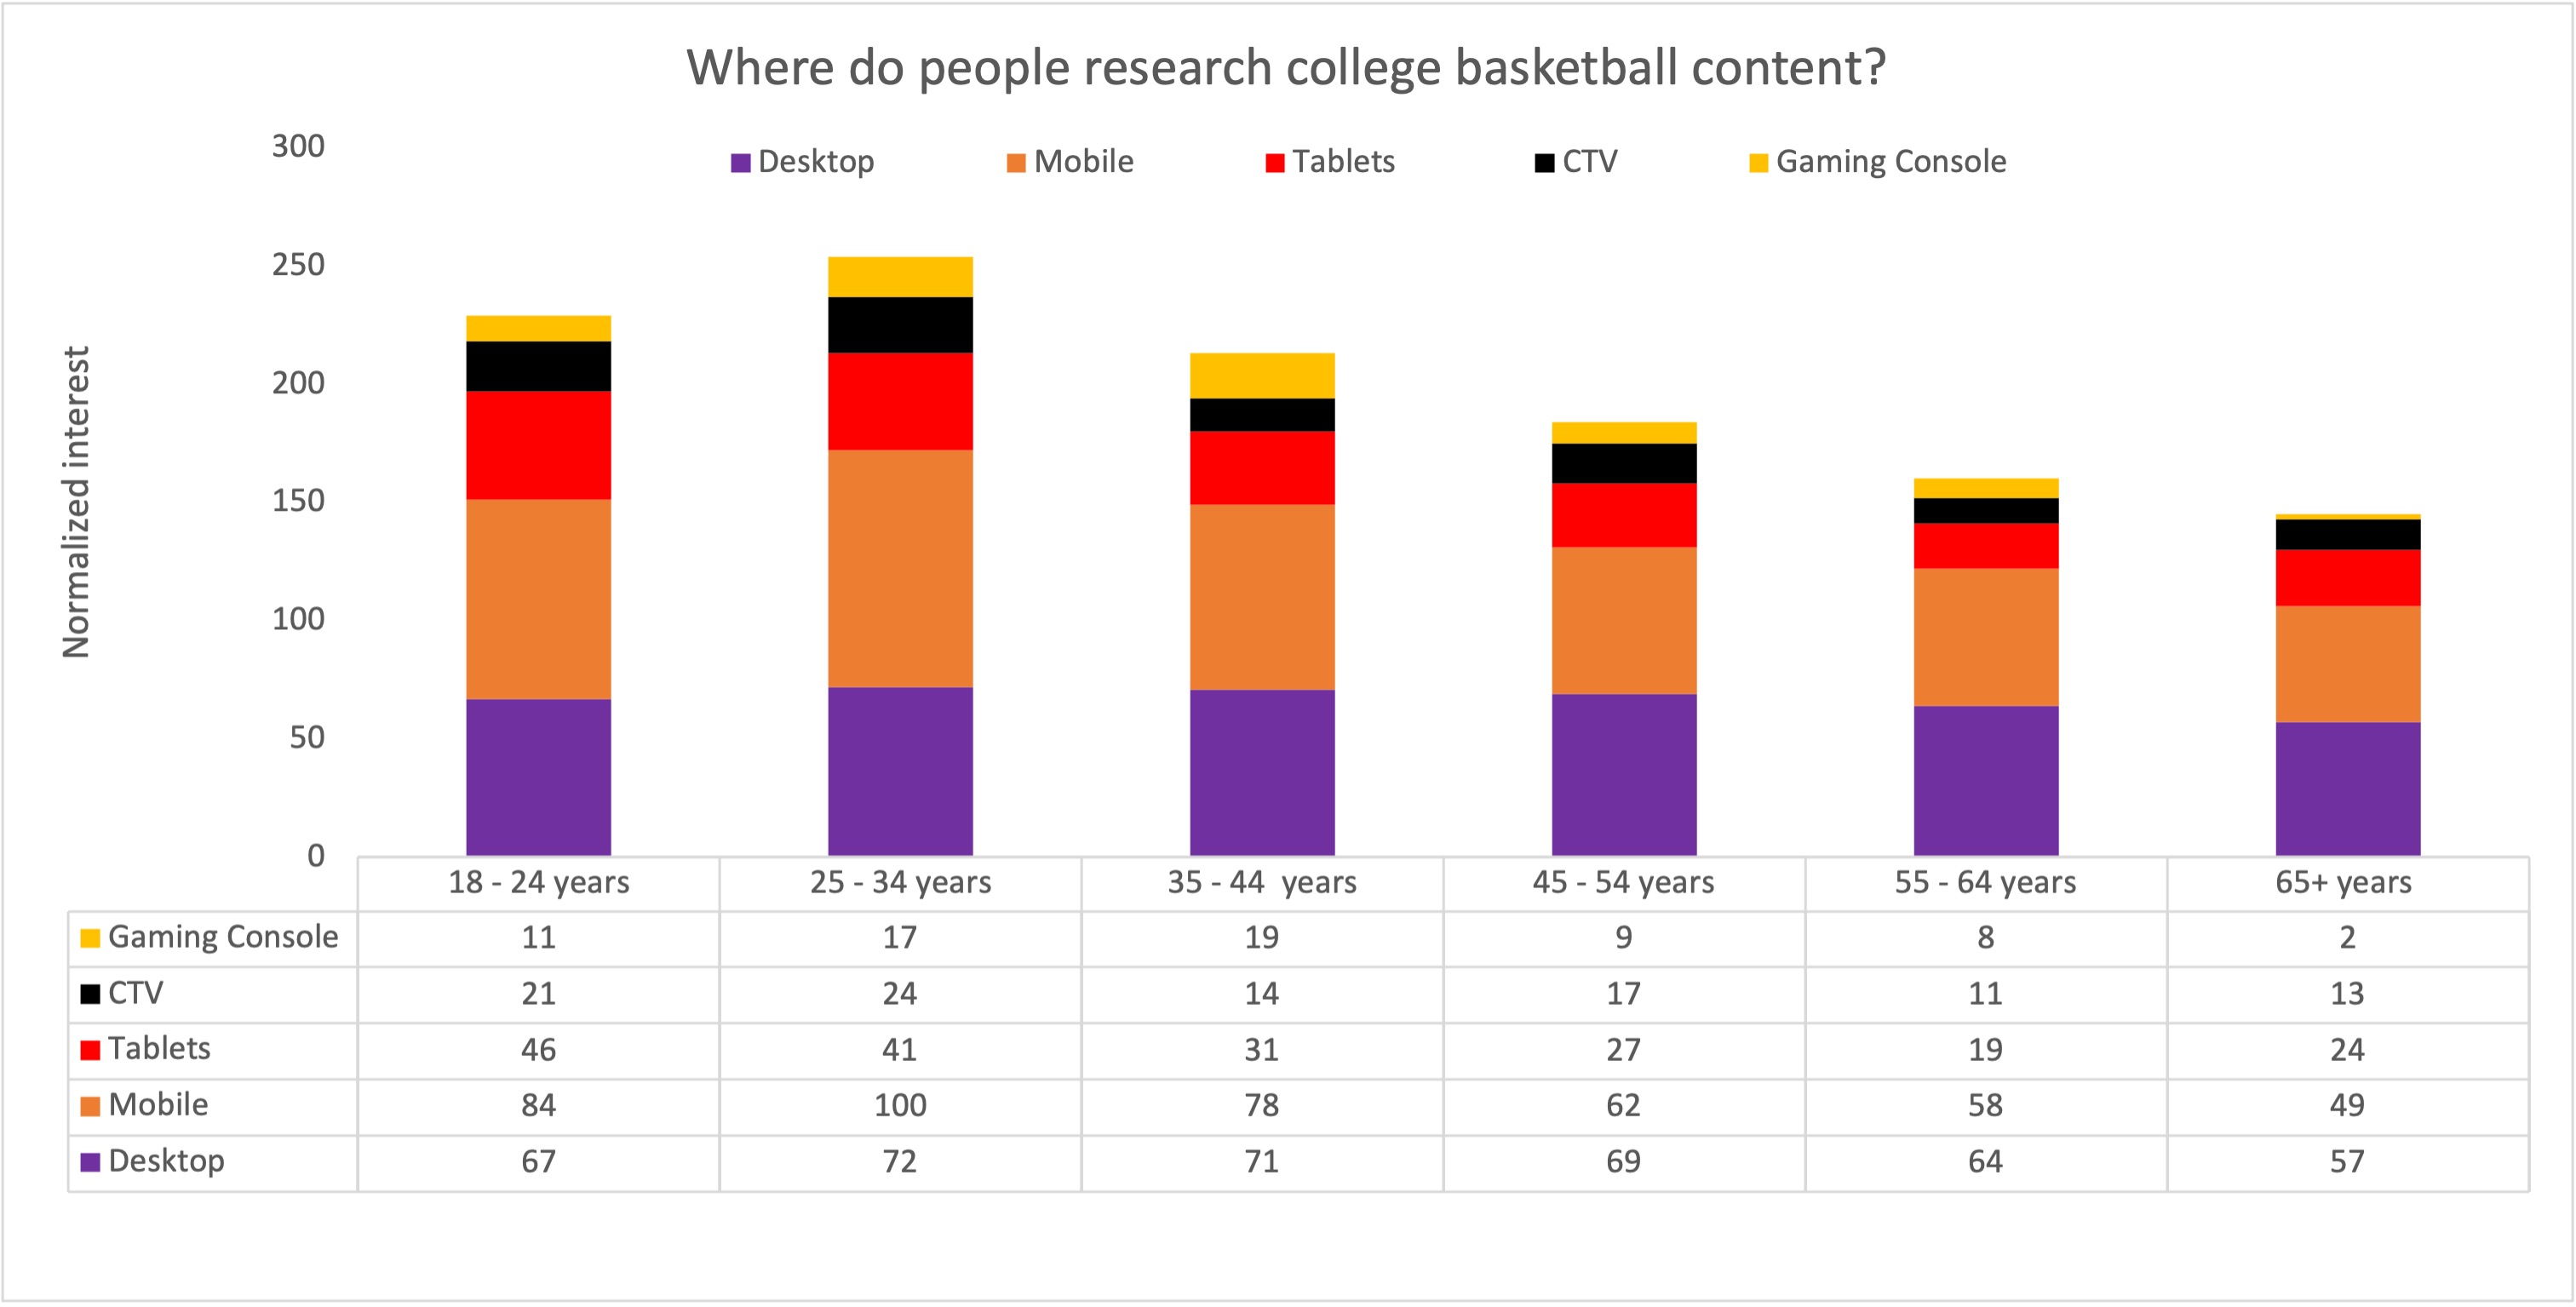
Americans aged 25-44 with a household income greater than $75k per year displayed a higher propensity (1.68 times the average) to place a bet online. A majority of these wagers were made over mobile platforms with an average user accounting for 17 sessions on gambling domains in March, a 54% month-over-month increase.
Cross-Platform Viewership Is Growing
The elevated interest in college basketball isn’t just about gambling. Ardent sports followers are also tuning in now more than ever just to catch the action live. TBS and TruTV accounted for a gross viewership of 7.6m viewers during the first four stages of the tournament, the highest recorded viewership for the stage of this tournament ever. CBS and Turner sports also reported record viewership numbers for the Sweet 16 stage, pulling in 12.9m viewers on an average (a 12% lift compared to 2019) indicating elevated levels of interest among college basketball followers.
While the scheduling of Elite 8 games on weekdays meant a smaller section of the fans were able to tune in to the live telecast of these games, increased demand (+18% week-over-week) for short match highlight reels on YouTube and online game summaries (+13% week-over-week) meant that audiences were finding new ways to stay in touch with the game even on workdays.
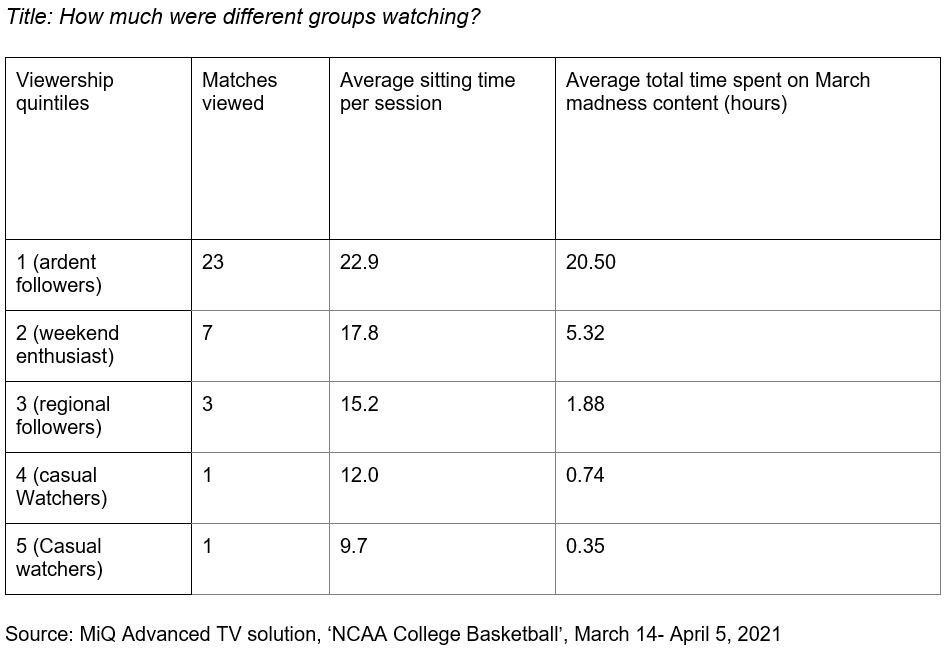
The top 20% of March Madness viewers consumed an average of 23-24 games through the tournament, consuming over 20 hours of live March Madness programming with a median sitting time of over 23 minutes. Casual audiences (the bottom quintile) tuned in for just a single game consuming just over 20 minutes of March Madness action. In terms of commercials viewed, the average ardent follower (in the top quintile) consumed close to 500 TV commercials during March Madness programming on average.
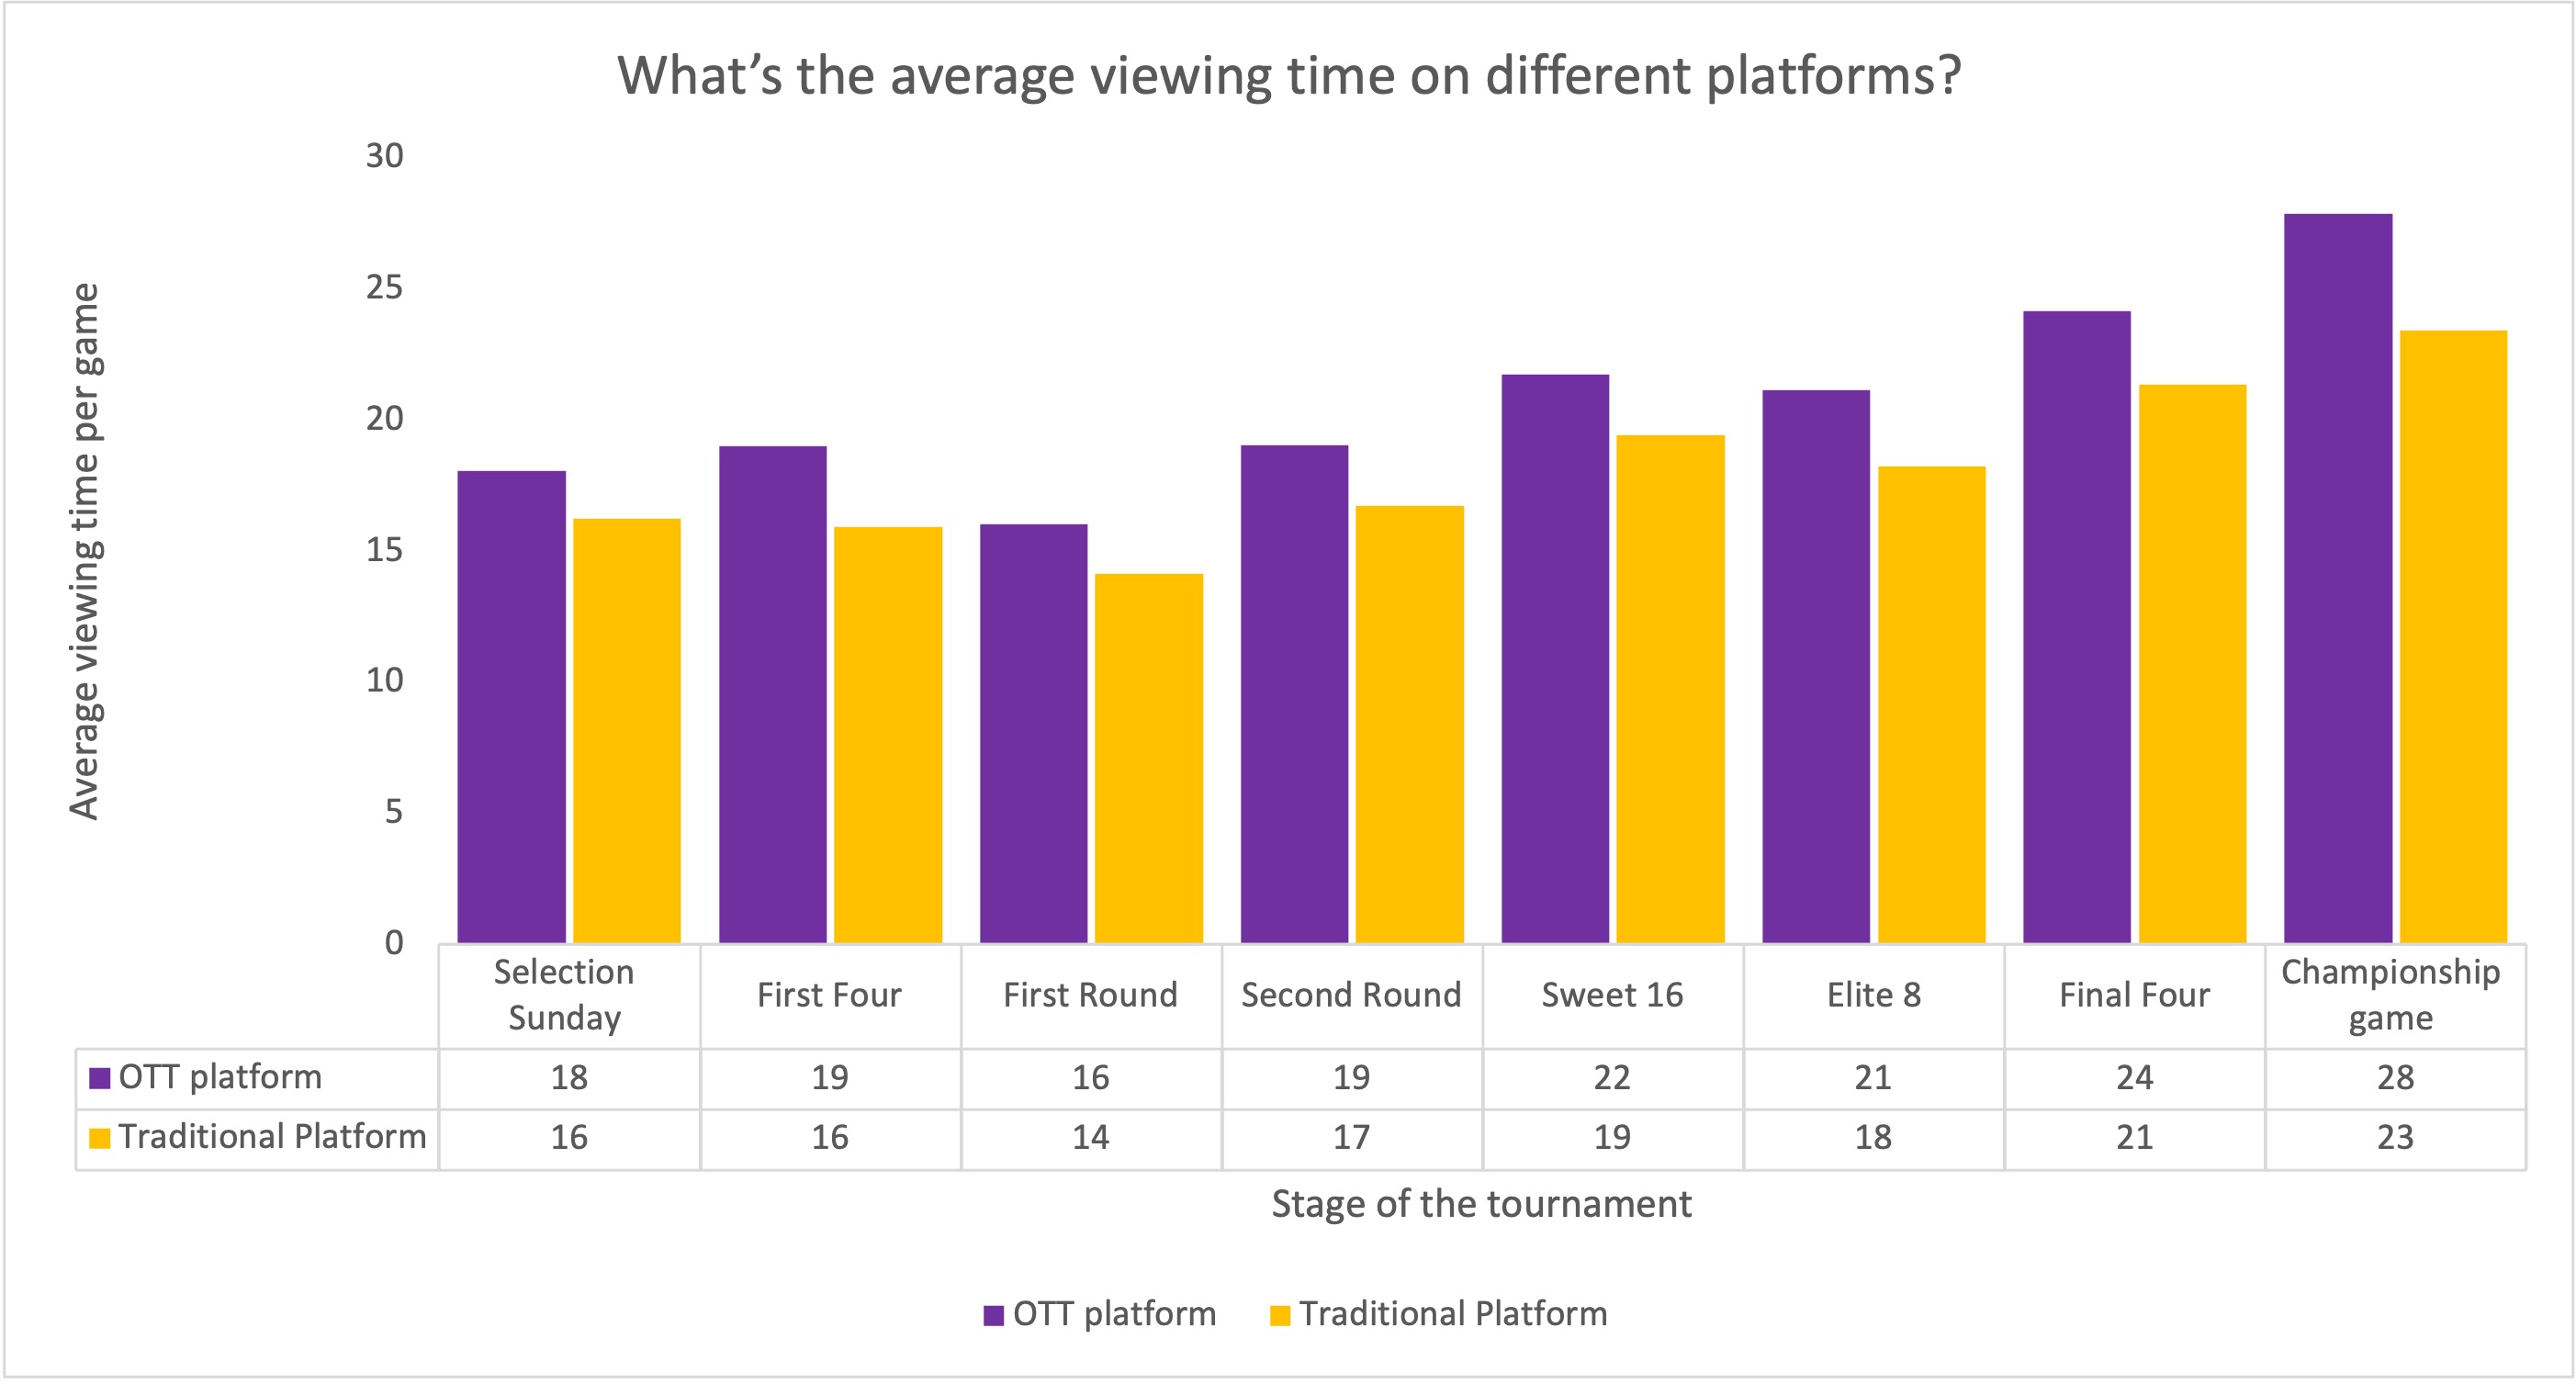
Linear TV continued to account for the bulk of March Madness viewership, with over 8 in 10 households engaging through traditional channels. But OTT and streaming audiences for sports programming has grown significantly - and continues to grow. Not only are more people tuning in through OTT, but OTT audiences are more engaged than traditional audiences when watching the game.
Increase in Second-Screen Opportunities
While more people are tuning in, their attention is more divided than ever. We observed a significant increase in cross-screen opportunities among March Madness audiences. Almost a quarter of March Madness viewers who tuned into the live telecast or stream were also found to be active on an alternate device. 40% of impressions generated on second screens were on the phone while almost half of second-screen opportunities were on desktops.
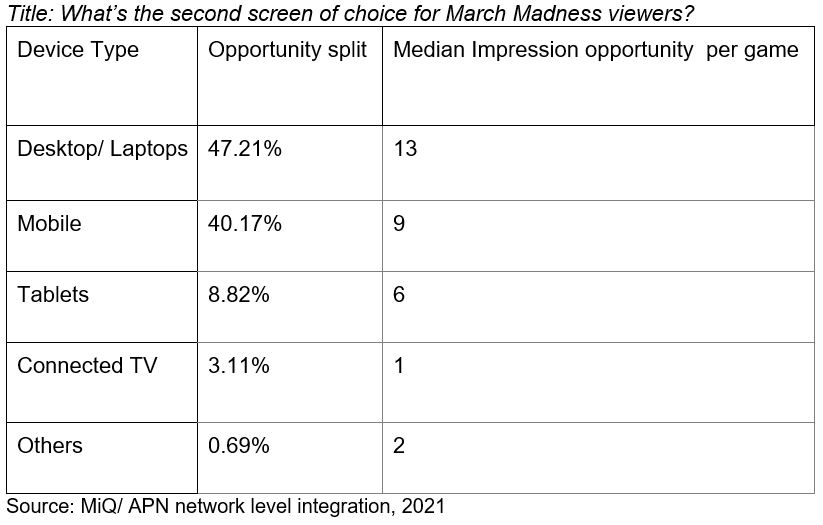
On average, three impression opportunities were generated on second screens during games. The most active online audiences (the top 10%) could be reached by up to 15 digital impressions per game. News, travel, and food and drinks domains were popular content categories among March Madness viewers during the game, while more people logged in for sports content post-game than before or during. Online activity was elevated on games scheduled on workdays indicating a lot of audiences tuned in to the game as they worked.
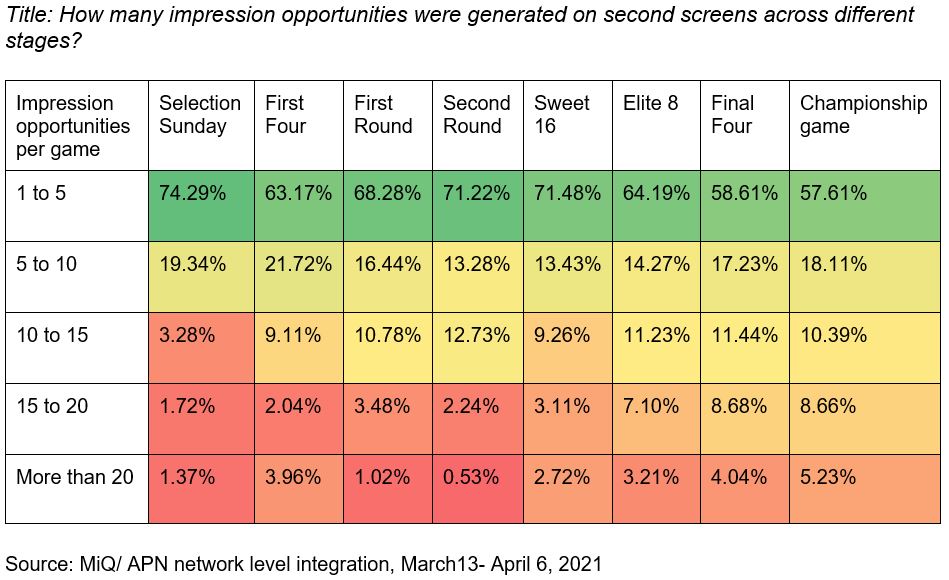
Phone usage during the game was higher among people aged 25-44 with higher relative household incomes, while older audiences were the least likely to be on another device. Those tuning in on weekdays seemed as if they were working while watching — the laptop/desktop activity was 11% higher as a percentage of all second-screen activity among households tuning in during the Elite 8 compared to the Sweet 16 and Final Four rounds.
More Online Food Orders
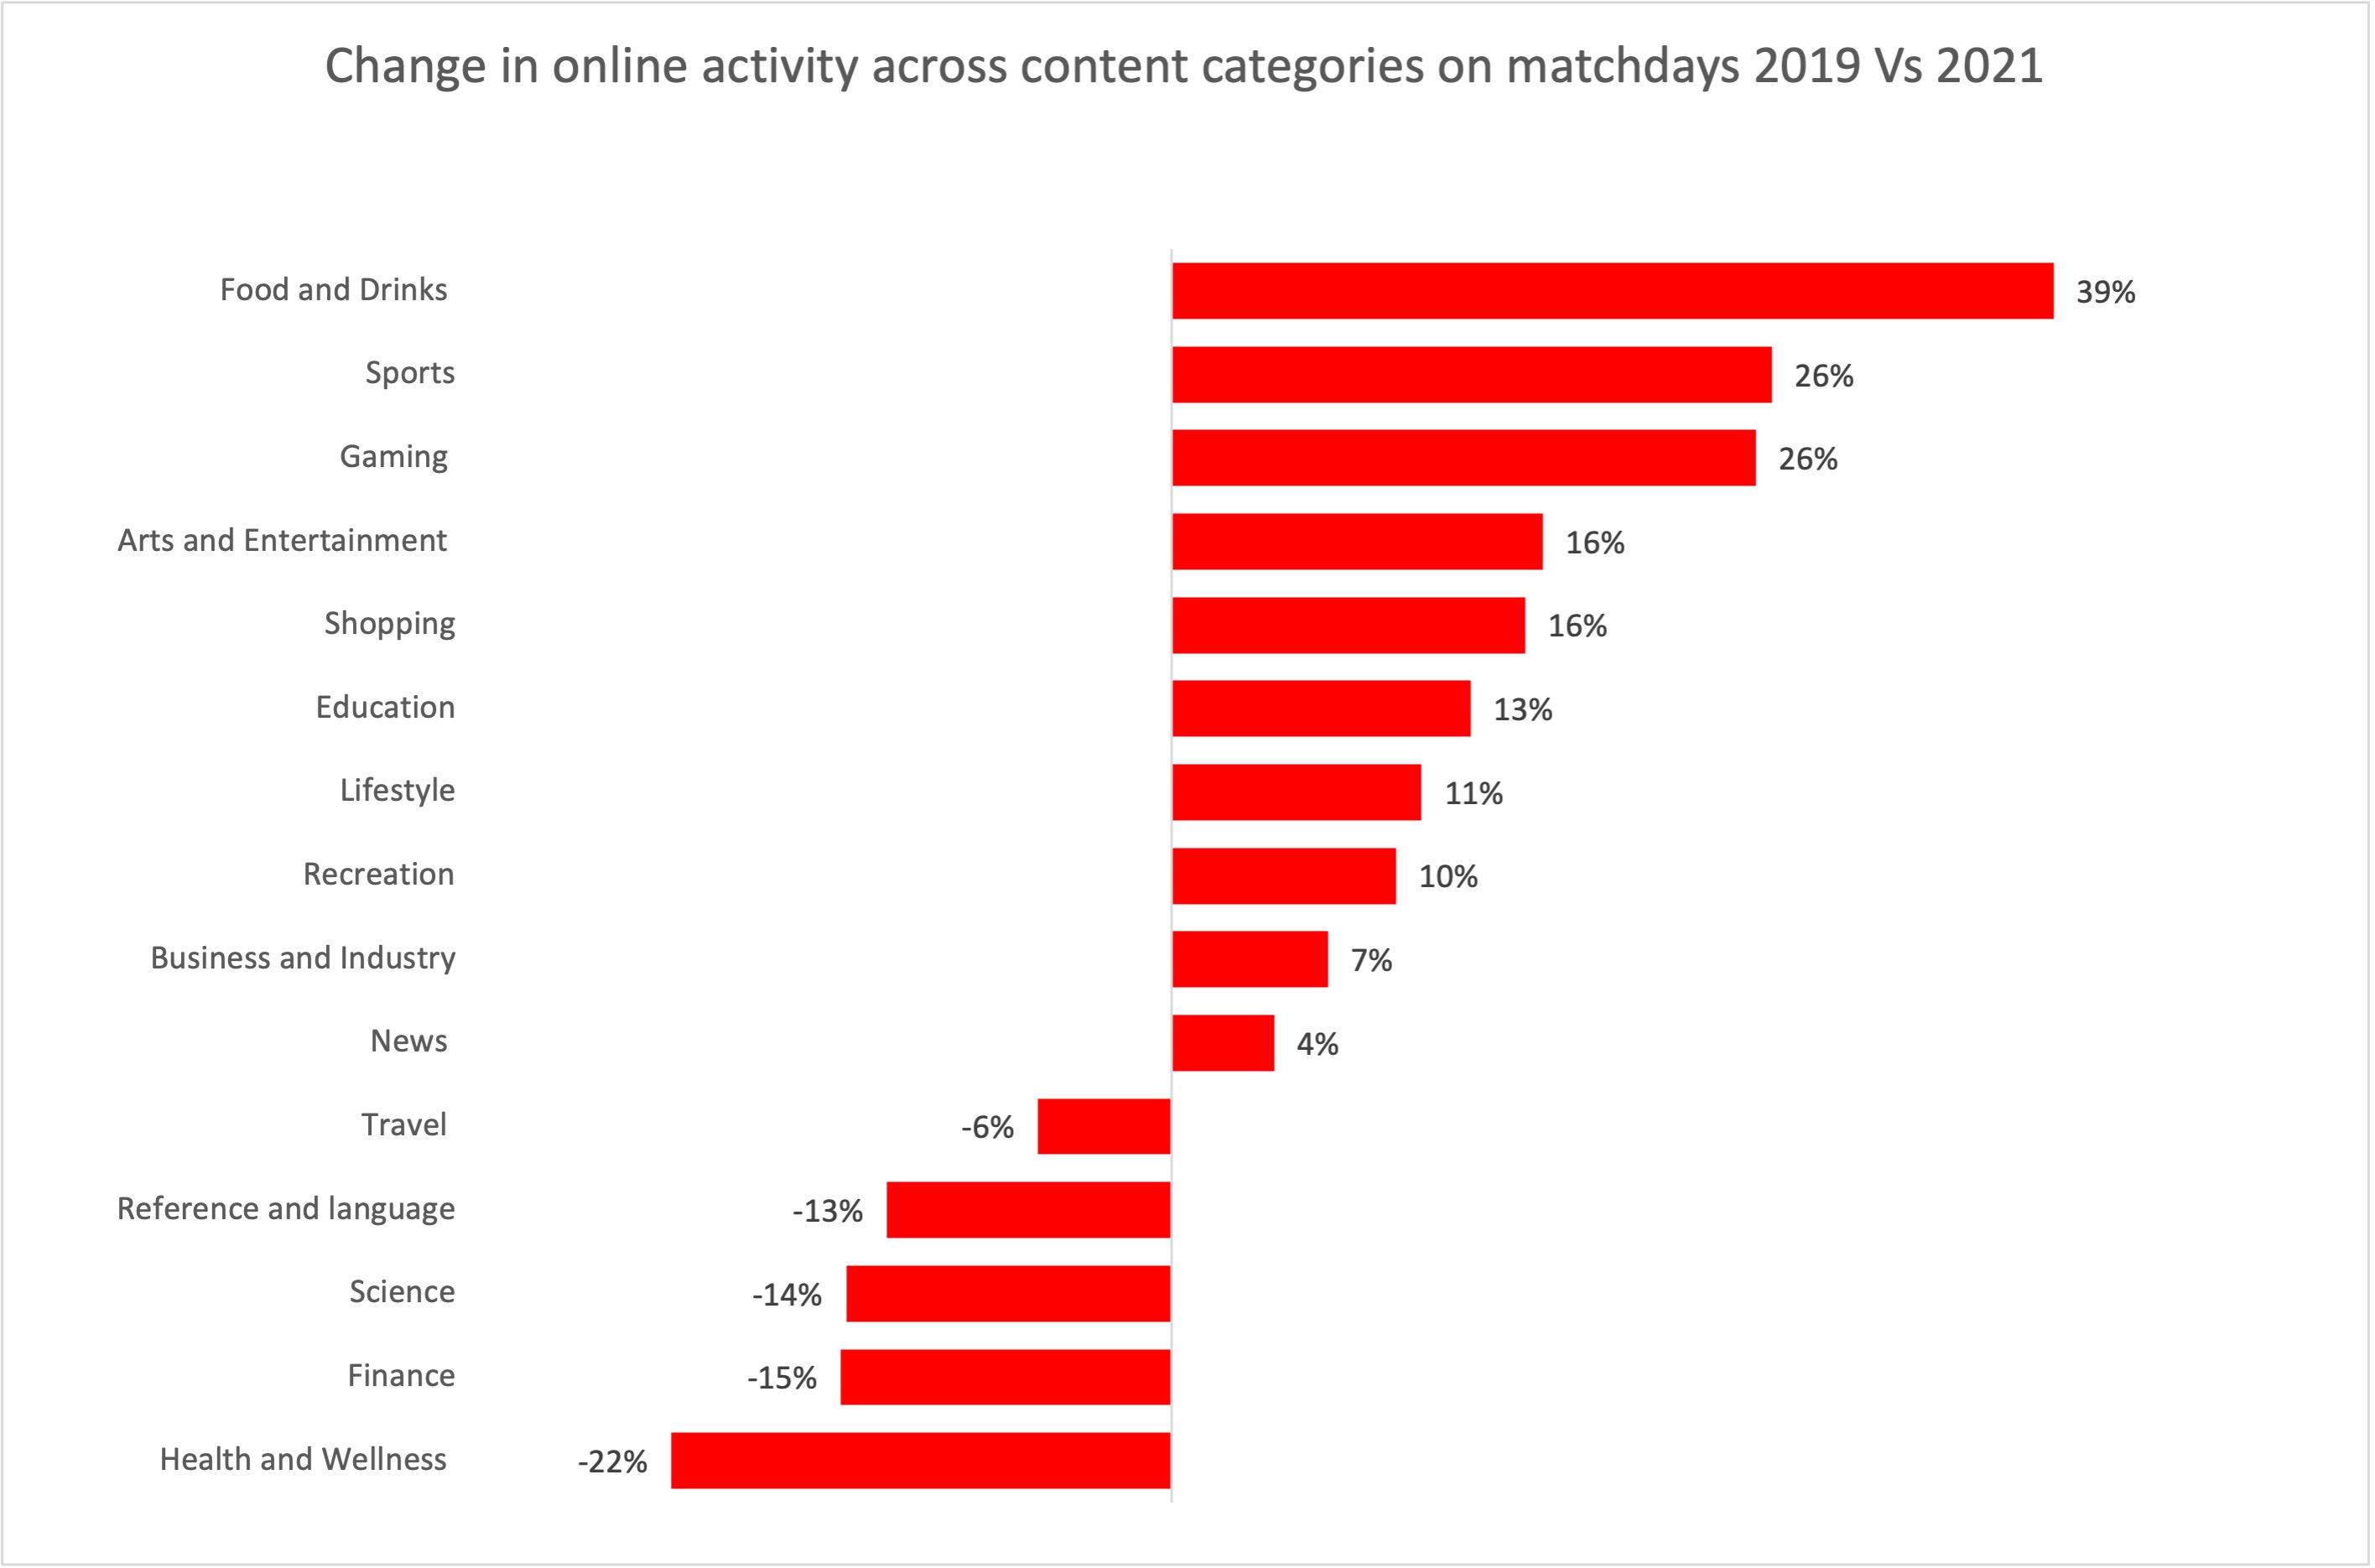
Continuing a trend from the Super Bowl, 21% more Americans looked to order food online during the tournament this year compared to the 2019 tournament. The apprehension around mobility and gathering in crowds continues to be a big driver for the elevated interest. Mid-income ($50K- $100K) millennial audiences (25-44) without any kids displayed a higher proclivity towards ordering in on game days. Activity across online gaming platforms during the tourney also saw a considerable increase (+26%) this year compared to 2019.
Social Engagement Up
General interest around college basketball on YouTube has also grown considerably this year, with more audiences interacting with game highlights and tutorials on “how to set up the perfect March Madness brackets.” Apart from increased engagement across YouTube, we also saw a 31% lift in engagement around the official social March Madness handles compared to the 2019. Gonzaga, Florida and USC are undoubtedly the online fan favorites, followed by Baylor and Michigan.
Methdology
We used MiQ’s proprietary Advanced TV integration with LG and Vizio to track the activity of more than 3 million households that tuned in to March Madness programming this year. These household profiles were further mapped to our ad serving integrations to create digital profiles of 7.8 million distinct March Madness followers, which were then used to analyze audience behavior online.
Rebecca Rosborough is chief marketing officer at MiQ, a programmatic media partner to marketers and agencies.
Rebecca Rosborough is chief marketing officer at MiQ, a programmatic media partner to marketers and agencies.
