Another Nielsen Critic: iSpot Says Ad Ratings Rose During COVID
iSpot says TV usage was up 7.3%, contradicting declines reported by Nielsen

The smarter way to stay on top of broadcasting and cable industry. Sign up below
You are now subscribed
Your newsletter sign-up was successful
Jumping into the controversy over Nielsen undercounting TV usage during the pandemic, measurement company iSpot says its system shows ad ratings were up during 2020.
Networks and distributors represented by the VAB questioned Nielsen’s reporting that showed television usage down during the pandemic. The VAB called for audits of Nielsen’s numbers and procedures, in particular how it handled its sample households while in-home visits were interrupted by COVID protocols.
Nielsen lost about 20% of its sample from March 2020 to March 2021, and the number of homes in the sample that reported no TV viewing increased sharply.
Initially Nielsen said the changes didn’t have a significant impact on its numbers. But a review overseen by the Media Rating Council revealed that Nielsen was undercounting viewing by as much as 6%.
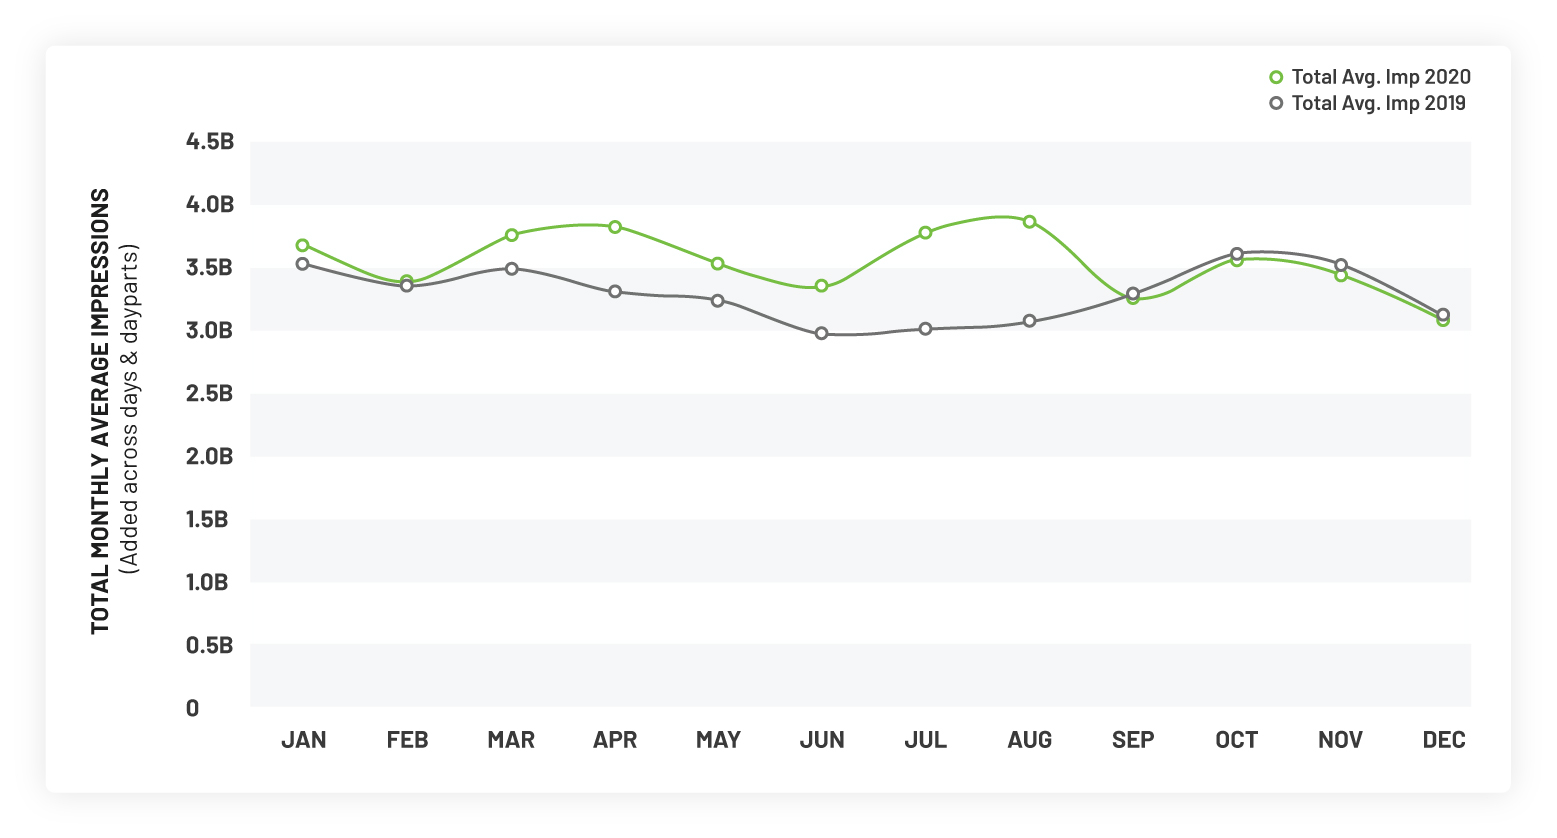
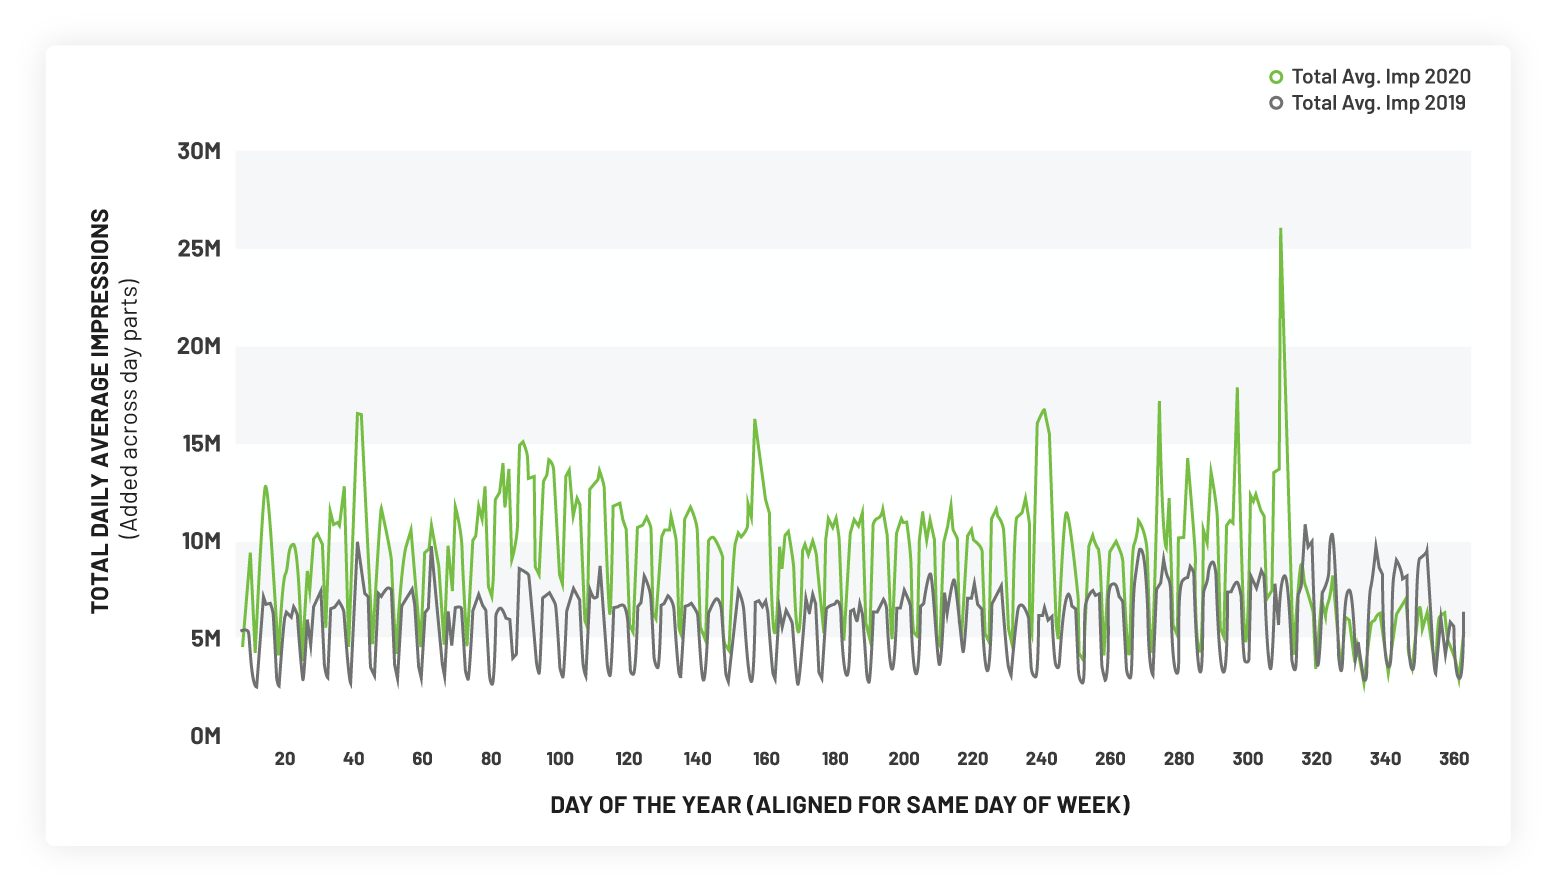
iSpot’s data shows that overall TV ad impressions were up 7.6% in 2020, compared to 2019.
Because iSpot focuses on measuring the impressions commercials generate and the impact those ads have on viewers, as opposed to estimating how many people watched a particular show, not all of iSpot’s numbers are comparable to Nielsen’s.
But iSpot data also show that TV usage was up 7.3% overall for 2020 over 2019, according to CEO Sean Muller.
The smarter way to stay on top of broadcasting and cable industry. Sign up below
Usage was up 4.3% in the first quarter, 12.3% in the second quarter and 16.3% in the third quarter before declining 1.4% in the fourth quarter.
iSpot has a panel of 18 million TVs where detection of every ad and program automatically occurs if the TV is on, Muller said. “Our approach to measurement isn’t prone to the challenges that Nielsen is experiencing, specifically,” he said.
iSpot found that ad ratings began the year slightly higher. The increase grew in March, when people started staying home because of the pandemic, and stayed high until September, when kids went back to school, iSpot said. The return of the National Basketball Association in August spurred the biggest increase in impressions.
Impressions fell off in the fourth quarter, particularly in primetime, because the production of scripted programming was disrupted and delayed by the pandemic. Despite the fourth-quarter slide, primetime TV ad impressions were up 1.2% for 2020, according to iSpot.
VAB CEO Sean Cunningham provided estimates of how much money networks might have lost because of Nielsen’s undercount. If the under-reporting was just 1%, it would cost the industry $468 million. If the undercount was 6%, it would cost $2.7 billion.
But with iSpot’s numbers indicating that commercial impressions were higher than reported, advertisers whose ad buys are based on Nielsen might have received make-good ads to compensate for shortfalls that didn’t really happen.
Nielsen responded in a statement.
“While we won’t comment on research done by this analytic firm, Nielsen has a long history of supplying actionable data and insights to our clients and the industry as a whole. Throughout COVID, Nielsen has remained transparent and committed to our clients and various industry groups, helping them understand the impacts of the COVID-19 pandemic on its data. We have also continued to innovate as we steadfastly move toward bringing the industry true, de-duplicative cross-platform measurement in the form of Nielsen One,” Nielsen said.
iSpot posted a blog post titled “While Traditional TV Ratings Proved Murky, One Thing is Clear: Ad Ratings Were Up During COVID.”
In it, Stuart Schwartzapfel, senior VP, media partnerships at iSpot, said the current issues over “understated” audiences is “more than just cause for concern; for many, it has generated calls to action.”
Advertisers want data that tracks their investment persistently and reliably, Schwartzapfel said.
“Despite the many disruptions during the pandemic, iSpot’s system did just that. And the results run counter to a prevailing narrative. While TV viewership for programming diminished, the amount of chances brands had to reach households actually increased,” Schwartzapfel said.
The blog post has iSpot data showing that the return of the NBA drove a 35.1% ad ratings increase for the networks that carry the league's games.
It also noted that cable network TV average ad impressions were up 63.5% on the year and up 68.4% in November when the election took place.
AT&T’s Turner networks, despite not being able to televise the NCAA Men’s Basketball Tournament, registered an increase in ad impressions of 33.6%, largely on the strength of CNN.
Discovery was also a winner, with TV ad impressions on its networks up 9.8%. DIY led the way with a 42.5% increase. Some of Discovery’s networks attracted viewers because they were able to air new programming home-made by the stars of their shows. People were also nesting and eating at home and the Discovery networks face no competition for viewers from sports.
iSpot’s Ad Rating is a measure of total households where at least one TV had a verified exposure to a given TV ad. The verification is done by the on-screen detection of the ad play in 18M homes, balanced and extrapolated to the U.S. Census. The Average Ad Rating is the average of all ad units for a particular date and daypart for a given network.

Jon has been business editor of Broadcasting+Cable since 2010. He focuses on revenue-generating activities, including advertising and distribution, as well as executive intrigue and merger and acquisition activity. Just about any story is fair game, if a dollar sign can make its way into the article. Before B+C, Jon covered the industry for TVWeek, Cable World, Electronic Media, Advertising Age and The New York Post. A native New Yorker, Jon is hiding in plain sight in the suburbs of Chicago.

