Another Sports-Studded Week for Viewership, Ad Impressions: TV By the Numbers
With insights from iSpot.tv & Vizio's Inscape
The smarter way to stay on top of broadcasting and cable industry. Sign up below
You are now subscribed
Your newsletter sign-up was successful
Below is a snapshot of TV by the numbers for the week of October 31 through November 6, highlighting the most-watched shows and networks using glass-level data from Vizio's Inscape, and network and show TV ad impressions insights via iSpot.tv.
Most-Watched Shows and Networks
Via Inscape, Vizio’s TV data product with glass-level insights from a panel of more than 19 million active and opted-in smart TVs. Data is linear, live TV only and includes all episode types (new and reruns). Rankings are by percent share duration (i.e., time spent watching).
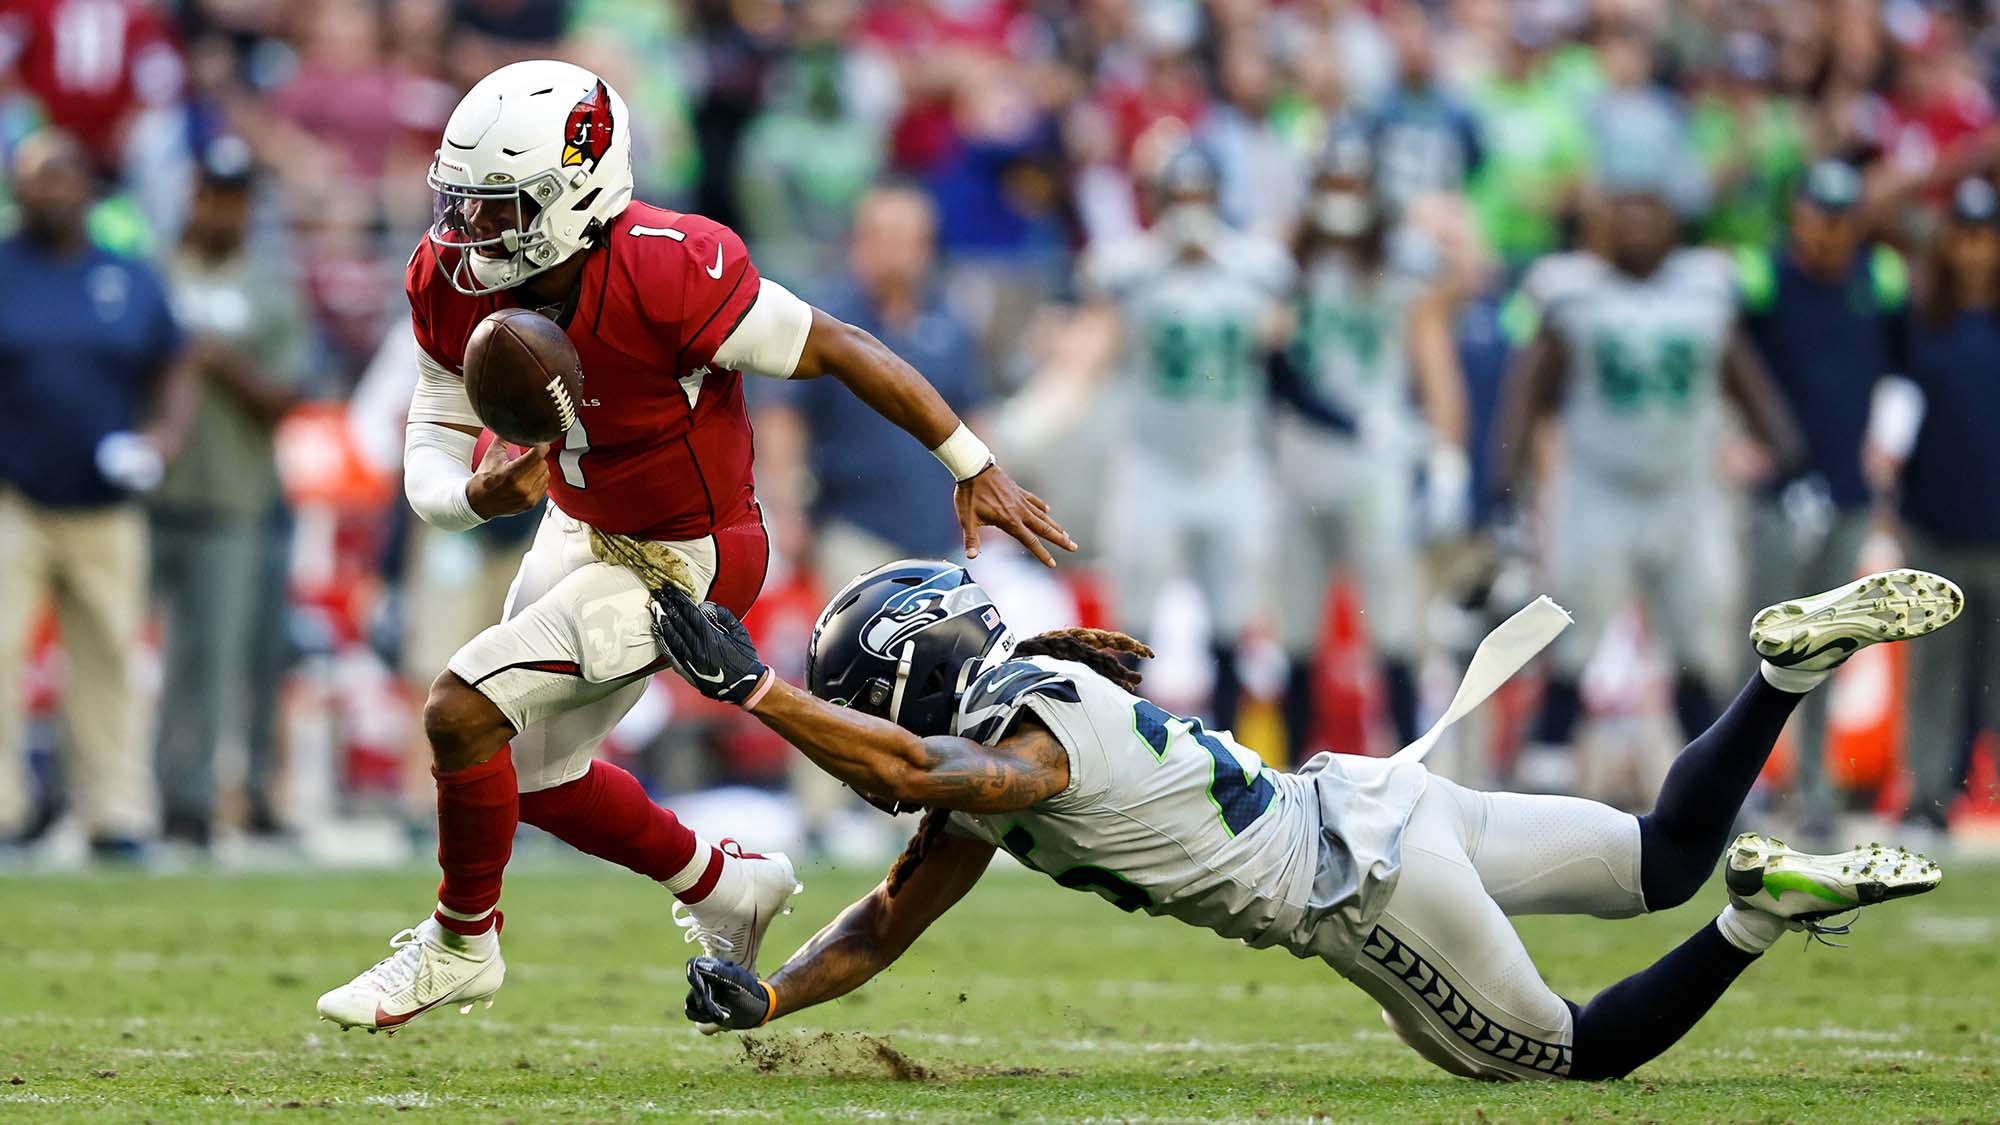
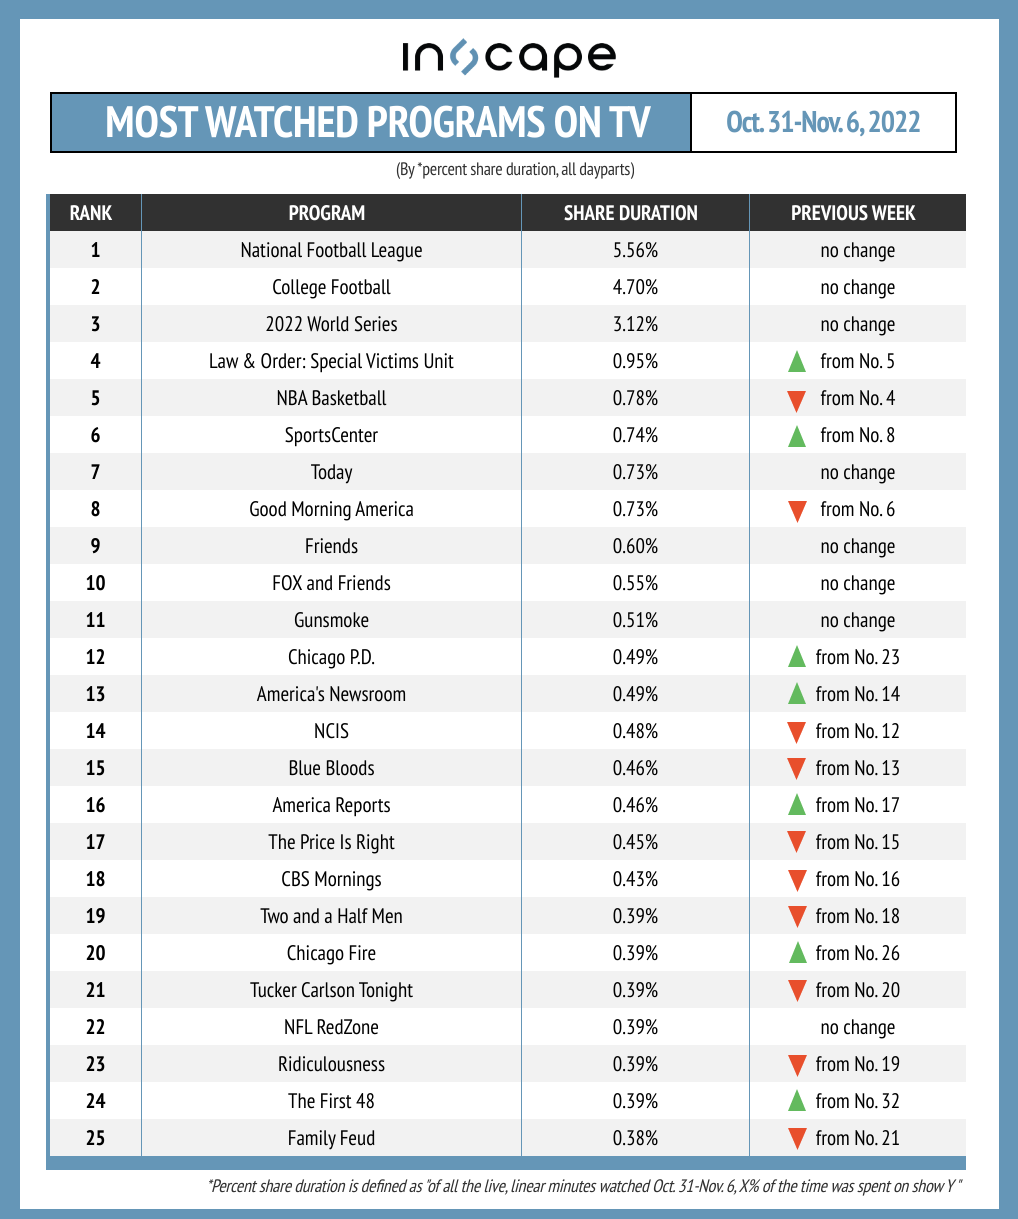
Sports continue to reign supreme, taking four of the top five spots for the most-watched programming during the week. NFL games accounted for 5.56% of minutes watched, down slightly from the previous week's 5.89%. On the other hand, college football saw an increase in watch-time, up to 4.70% from 3.95% previously.
Some additional insights about the top programming on TV:
- After six games, the Houston Astros defeated the Philadelphia Phillies in the World Series, which accounted for 3.12% of watch-time during the week.
- Chicago P.D. makes a notable jump up the chart, moving to No. 12 from No. 23, fueled by reruns on ION and USA Network, as well as a new episode that premiered on NBC on Nov. 2.
- Fox News programs America's Newsroom and America Reports both move slightly up the chart, to No. 14 and No. 16, respectively.
- Week-over-week newcomers include Chicago Fire (0.39%) and The First 48 (0.39%), shifting into the No. 20 and No. 24 chart positions, respectively.
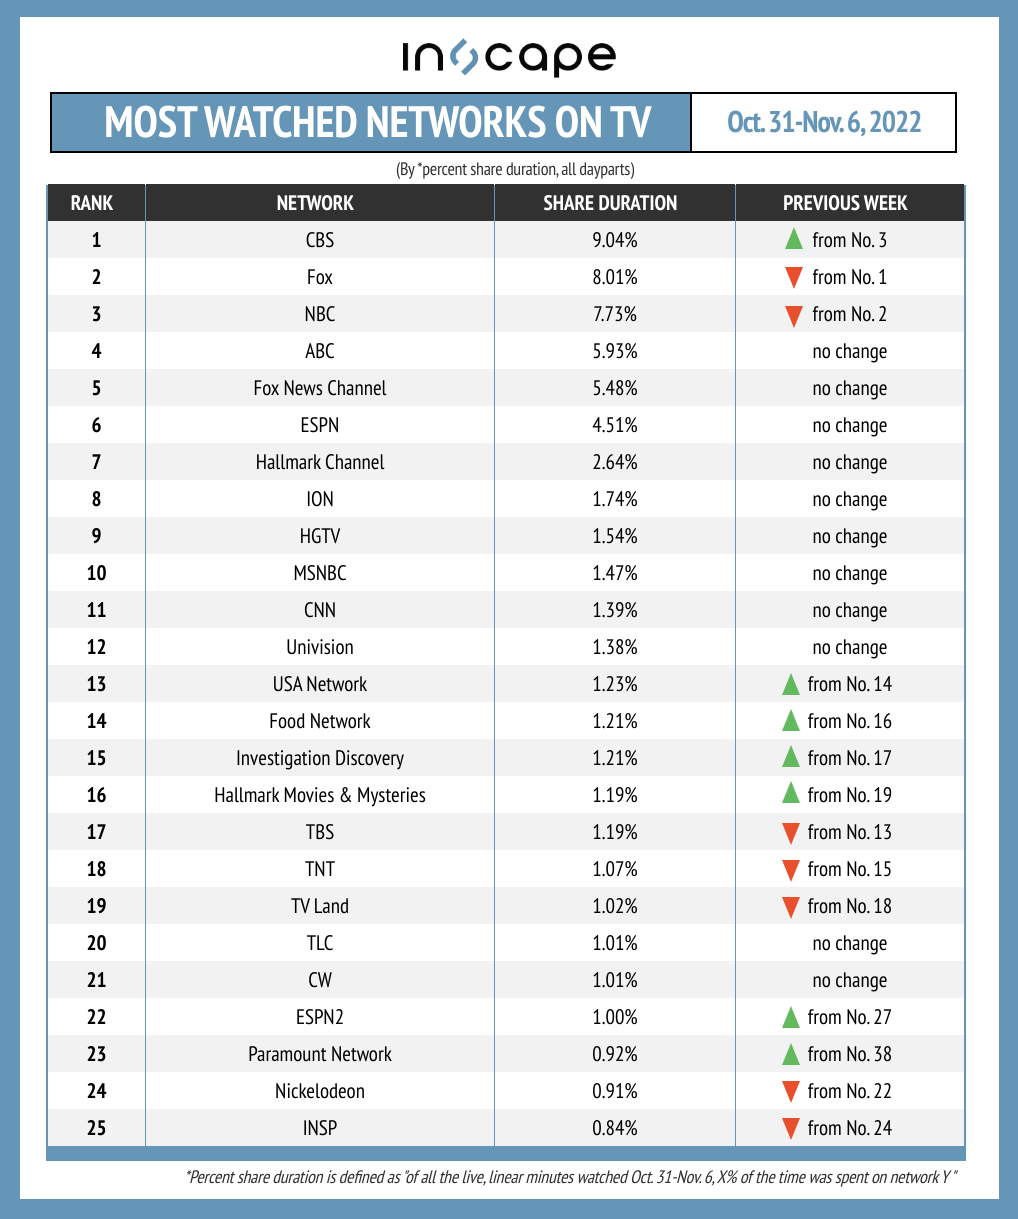
On the network side of things, CBS is in first place, thanks in part to NFL and college football, with 9.04% of minutes watched (up from 7.32% the previous week).
Additional insights around the most-watched networks from October 31 through November 6:
- Fox, benefiting primarily from the World Series, edges out NBC to take second place with 8.01% of watch-time.
- Although Fox News Channel, ESPN and Hallmark Channel all retain their chart positions week-over-week, each saw a slight uptick in minutes watched.
- Newcomers that didn't appear on the previous week's ranking include ESPN2, up from No. 27 to No. 22, and Paramount Network, up to No. 23 from No. 38.
- Paramount's notable jump came from a Yellowstone marathon over the weekend — the network's hit show, which returns for season five on November 13 — accounted for over 40% of Paramount Network's total watch-time for the week.
Top Shows and Networks by TV Ad Impressions
Via iSpot.tv, the real-time TV measurement company. Rankings are by share of TV ad impressions, for new episodes only.
The smarter way to stay on top of broadcasting and cable industry. Sign up below
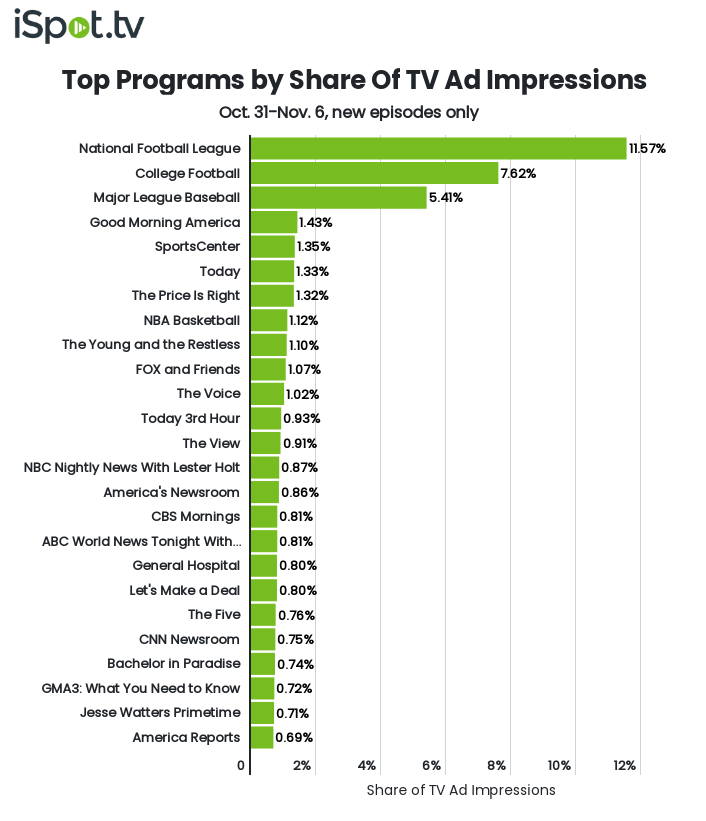
The NFL remains in first place, but saw a slight decrease in share of TV ad impressions, to 11.57% from 12.29% the previous week. College football is steady at No. 2 with an impressions share of 7.62%.
More insights about the top programs by TV ad impressions:
- Although the World Series stays in third place week-over-week, it saw a notable increase in share of TV ad impressions (up to 5.41% from 3.09% previously), with a nearly 75% jump in total TV impressions compared to the week before.
- The Voice, which premiered two of its three "The Knockouts" episodes during the week, moves into eleventh place with 1.02% share of impressions, up from 0.94% last time.
- ABC World News Tonight with David Muir moves up one place, from No. 18 to No. 17 (from 0.55% share of impressions to 0.87%), while Fox & Friends remains in 10th but with a slight impressions increase (from 1.06% to 1.07%).
- Daytime soap opera General Hospital jumps up the ranking to No. 18 from No. 22 previously, increasing its share of impressions from 0.70% to 0.80%.
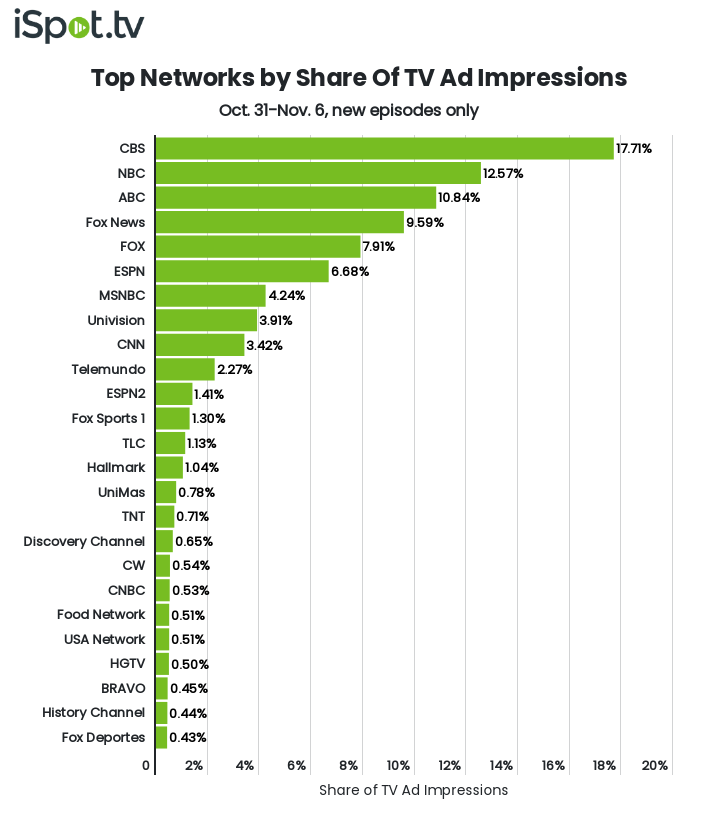
CBS takes first place in the network ranking, with a week-over-week increase in TV ad impressions share — up to 17.71% from 14.92%. NBC takes second place, with impressions fueled by NFL games, Today and The Voice.
Additional insights around the top networks by impressions share:
- ABC moves into third place, albeit with a slight week-over-week decrease in impressions (down to 10.84% from 11.55% previously).
- Discovery and The CW both have notable upward movement, from No. 22 to No. 17 and from No. 23 to No. 18, respectively. Street Outlaws, Gold Rush and Moonshiners delivered top impression counts for Discovery, while The CW benefited from Stargirl, Walker and Family Feud.
- Food Network moves up the chart from No. 24 to No. 20, with seasonal programming including Holiday Wars, Halloween Baking Championship and Christmas Cookie Challenge generating top impression counts.
- With a 0.44% share of impressions, History Channel was the sole week-over-week newcomer, landing at No. 24 from its previous place at No. 26.
