Football Leads for Watch-Time, Ad Impressions, But Basketball Jumps Up: TV By the Numbers
With insights from iSpot.tv & Inscape
The smarter way to stay on top of broadcasting and cable industry. Sign up below
You are now subscribed
Your newsletter sign-up was successful
Below is a snapshot of TV by the numbers for the week of November 14-20, highlighting the most-watched shows and networks using glass-level data from Inscape, and network and show TV ad impressions insights via iSpot.tv.
Most-Watched Shows and Networks
Via Inscape, the currency-grade smart TV ACR data provider and data technology division of Vizio with insights from a panel of more than 20 million opted-in TVs. Data is linear, live TV only and includes all episode types (new and reruns). Rankings are by percent share duration (i.e., time spent watching).
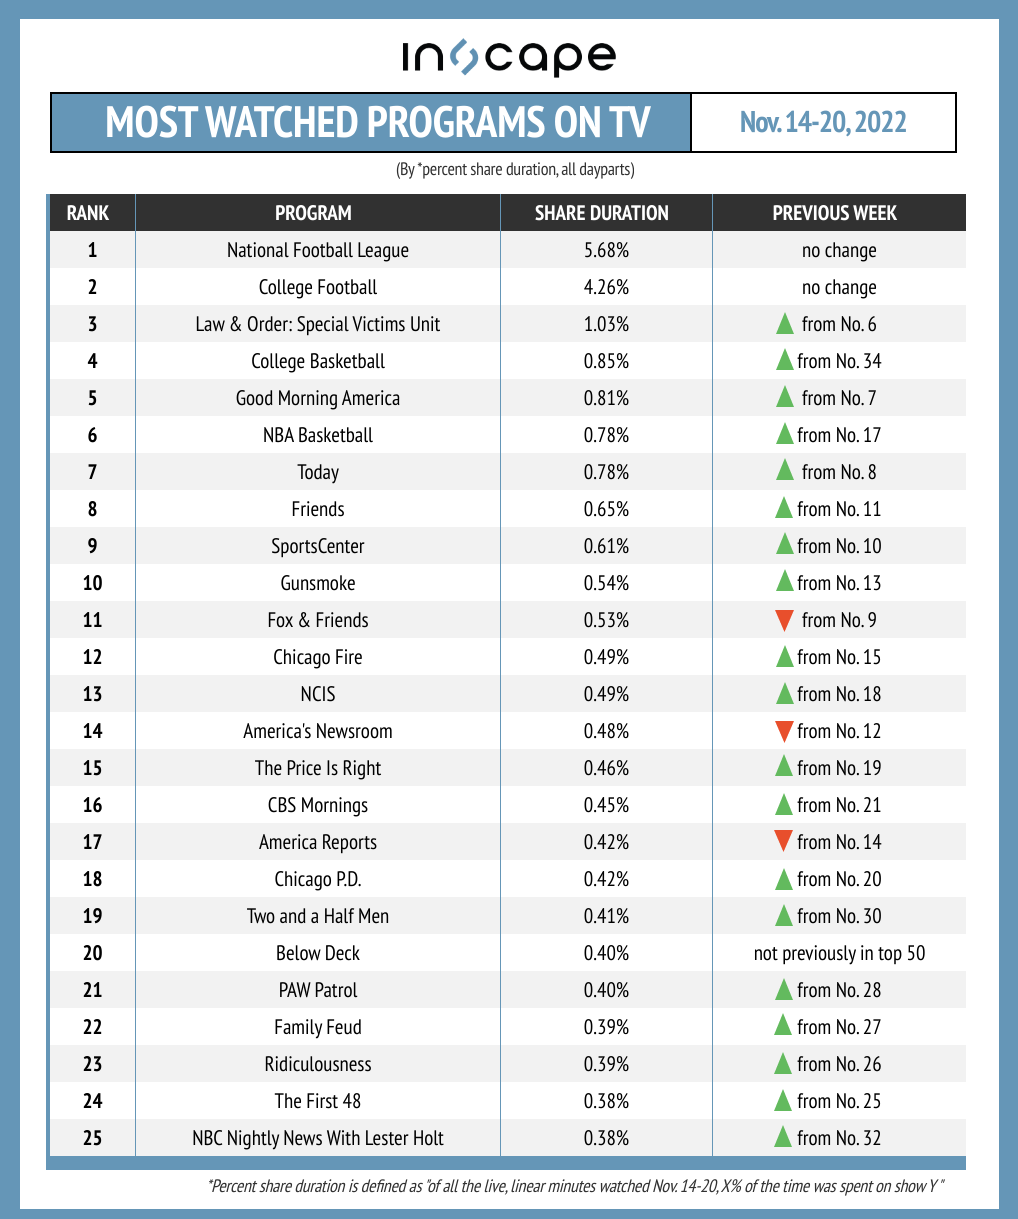
While the NFL and college football retain their first and second place positions week-over-week, both had small decreases in minutes watched: NFL games accounted for 5.68% of watch-time (down from 5.87% previously), and college football slipped to 4.26% from 4.50% the week prior.
Some additional insights about the top programming on TV:
- The NBA and college basketball jump into the top 10 on the ranking, moving from No. 17 to No. 6, and No. 34 to No. 4, respectively.
- Just three programs have lower chart positions week-over-week: Fox & Friends, America’s Newsroom and America Reports.
- Below Deck moves into the ranking at No. 20, thanks to Bravo’s rerun marathons in the week leading up to the season 10 premiere on November 21.
- Additional week-over-week newcomers include Two and a Half Men, Paw Patrol, Family Feud, Ridiculousness and NBC Nightly News with Lester Holt.
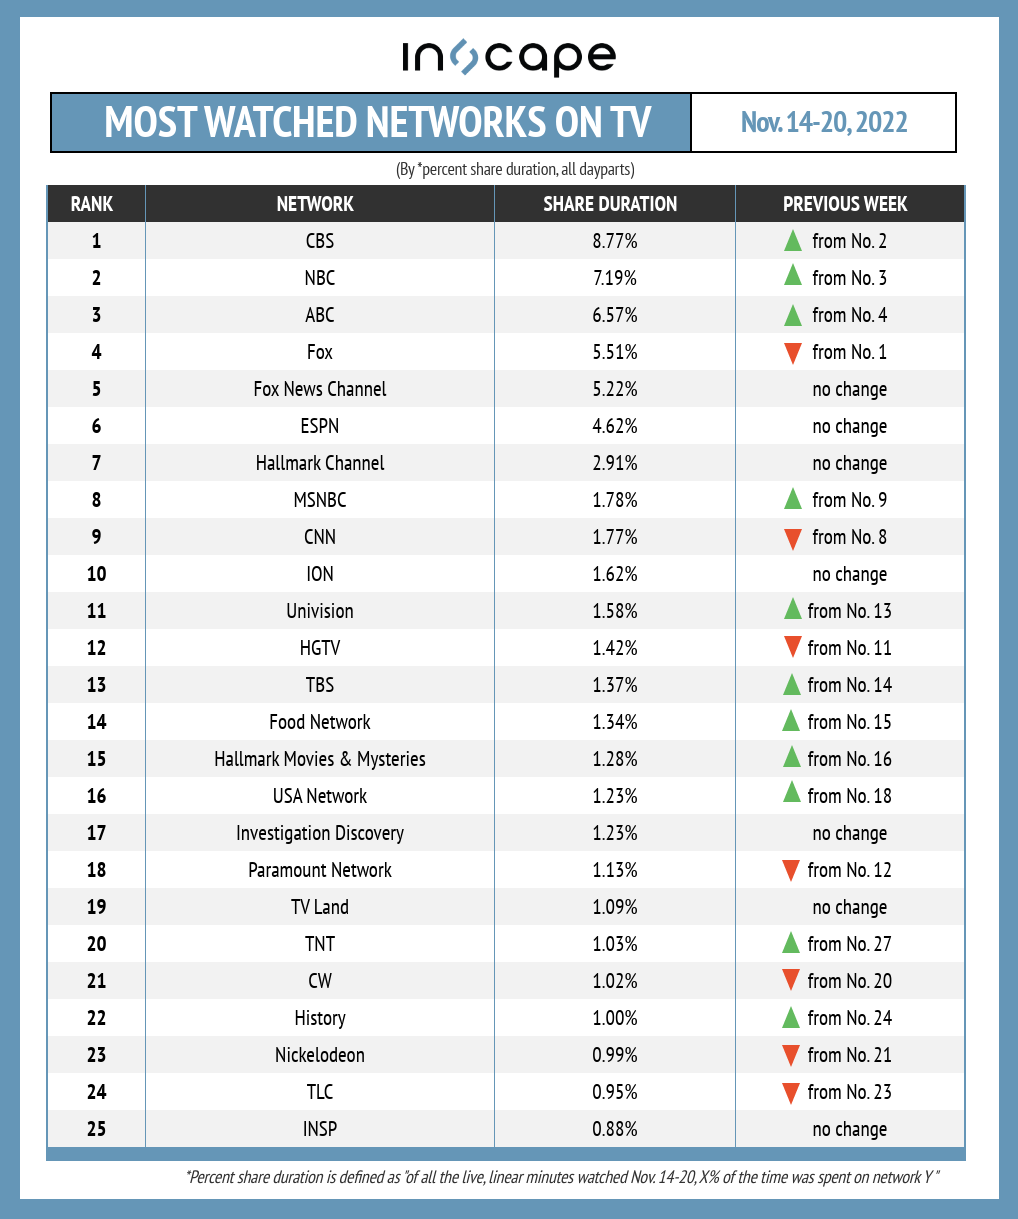
CBS leads the list of most-watched networks, accounting for 8.77% of watch-time, up from 7.08% previously. NBC also saw a week-over-week gain in viewership, moving into second place with 7.19% of minutes watched (up from 6.81% the week before).
Additional insights around the most-watched networks from November 14-20:
- TNT is the sole week-over-week newcomer to the ranking, landing at No. 20 with 1.03% of watch-time. NBA games accounted for 16.78% of viewing time on the network.
- Although Hallmark Channel retains its seventh place position week-over-week, it had a slight increase in watch-time (up to 2.91% from 2.63% previously). Holiday fare continues to drive viewership, with the top programming including the original TV movies Three Wise Men and a Baby, Inventing the Christmas Prince and The Royal Nanny.
- History Channel continues to make gains, taking No. 22 with 1.00% of watch-time, up from No. 24 the week previously and No. 26 the week before that. Nearly a quarter (21.24%) of the network’s watch-time came from reruns as well as the first episode of season 10 of The Curse of Oak Island.
- Although Nickelodeon slips to No. 23 from No. 21 previously, it had a week-over-week increase in watch-time (from 0.97% to 0.99%).
Top Shows and Networks by TV Ad Impressions
Via iSpot.tv, the real-time TV measurement company. Rankings are by share of TV ad impressions, for new episodes only.
The smarter way to stay on top of broadcasting and cable industry. Sign up below
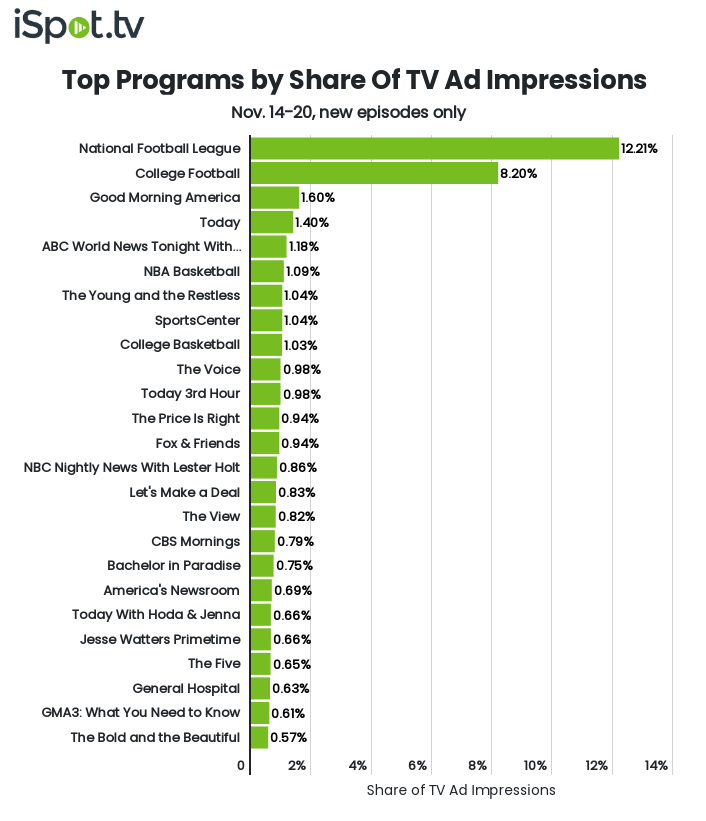
The NFL continues to dominate TV ad impressions share, but with a slight week-over-week decrease, from 12.29% to 12.21%. College football also slipped, down to 8.20% from 9.02% previously.
More insights about the top programs by share of TV ad impressions:
- NBA basketball jumps into sixth place with a 1.09% impressions share, a notable increase from the previous week’s 0.44%.
- College basketball saw a similar increase, moving into ninth place with a 1.03% impressions share, up from 0.41% previously.
- Fueled by “Live Top 16 Performances” and “Live Top 16 Eliminations” episodes, The Voice takes 10th place, up from No. 22 previously.
- With two new episodes airing during the period measured, Bachelor in Paradise enjoys a ranking rise, taking No. 18 with a 0.75% share of TV ad impressions.
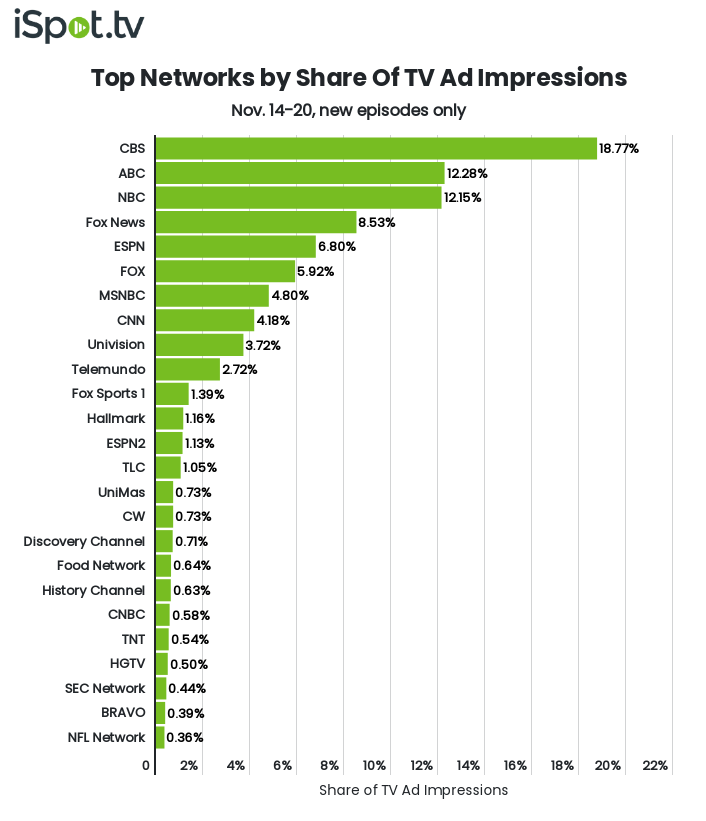
CBS takes first place in the network ranking with a week-over-week increase in TV ad impressions share, up to 18.77% from 14.06%. NFL games alone accounted for over 31% of the network’s total impressions during the week.
Additional insights around the top networks by share of TV ad impressions:
- While ABC and NBC retain their second- and third-place positions, respectively, both had week-over-week increases in impressions share: ABC went from a 12.03% share to 12.28%; NBC from 11.36% to 12.15%.
- ESPN moves up one place to No. 5 with a 6.80% share of impressions. Over half of the network’s total impressions came from college basketball and college football.
- History Channel makes a notable jump from No. 28 previously to No. 19, with new episodes of The Curse of Oak Island and its spin-offs (Digging Deeper and Drilling Down), as well as Pawn Stars Do America and Mountain Men, contributing top TV ad impression counts.
- TNT is another week-over-week ranking newcomer, doubling its impressions share and moving up to No. 21 from No. 37, with ad impressions primarily driven by NBA games.
