National TV Ad Revenues Post Gain in May, Says SMI

The smarter way to stay on top of broadcasting and cable industry. Sign up below
You are now subscribed
Your newsletter sign-up was successful
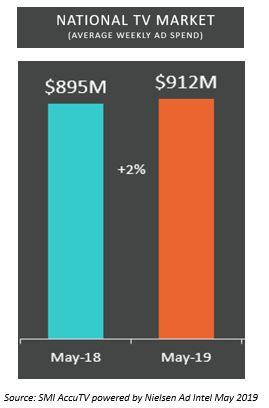
Ad spending on national TV rose 2% in May to $912 million, according to new figures from Standard Media Index.
The figures are another sign of renewed vitality of the TV advertising business in the face of streamers pulling away viewers and digital competitors drawing ad dollars. TV networks have been seeing strong demand from advertisers during the ongoing upfront ad market, with volume apparently up and primetime commercial prices increasing by 12% to 16% on a cost-per-thousand viewers basis.

Broadcast ad spending was up 5.1% to $1.2 billion, driving by golf’s PGA tournament moving to May from August this year.
National cable ad spending was up 0.5% to $2.4 billion.
“We continue to see strengthening conditions in the second quarter for the National TV market after a soft first quarter, even factoring in the Olympics inflated annual comparison. In fact, May 2019 has delivered its strongest seasonally adjusted result since we began measurement. This reinforces the continued power of National TV and is in line with results being achieved in recent Upfront negotiations,” said James Fennessy, CEO of Standard Media Index.
Comcast’s NBCUniversal unit had an 18.7% share of the national TV market. It was followed by the Walt Disney Co. with a 16% share, AT&T with a 12.1% share, Discovery at 11.9% and CBS at 9.7%.

Spending on sports programming was up 4.7% to $600 million due to the golf tournament being rescheduled. Spending on entertainment programming was up 1.4% to $2.6 billion and news was up 1.2% to $400 million.
The smarter way to stay on top of broadcasting and cable industry. Sign up below
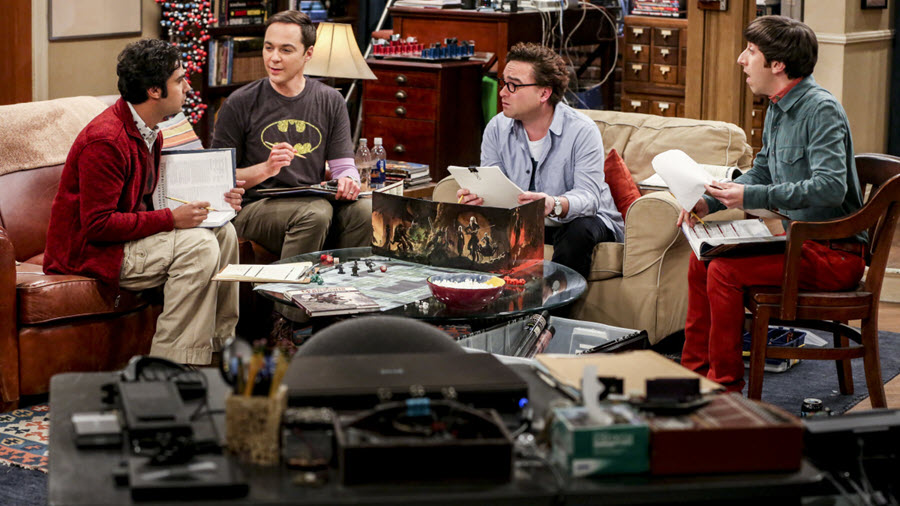
Broadcast entertainment spending was up 1.6%, powered by the series finale of CBS’s The Big Bang Theory. Revenues generated by the concluding episode were up 27% from a year ago.
Between airing on CBS and reruns appearing on TBS, The Big Bang Theory generated $63 million in ad revenues in May. The No. 2 share was NBC’s The Voice, which was down 10% to $50M.
Cable entertainment spending was up 2.6%, with Discovery’s HGTV and Food Network posting gains, along with NBCU’s Bravo.
SMI draws its spending data from invoices received by most of the world’s biggest media buying groups, accounting for 70% of all agency spending.
Jon has been business editor of Broadcasting+Cable since 2010. He focuses on revenue-generating activities, including advertising and distribution, as well as executive intrigue and merger and acquisition activity. Just about any story is fair game, if a dollar sign can make its way into the article. Before B+C, Jon covered the industry for TVWeek, Cable World, Electronic Media, Advertising Age and The New York Post. A native New Yorker, Jon is hiding in plain sight in the suburbs of Chicago.

