NBC Cranks Up Summer Olympics Promos, Food Network Pushes ‘Cooks vs. Cons’

The smarter way to stay on top of broadcasting and cable industry. Sign up below
You are now subscribed
Your newsletter sign-up was successful
B&C has partnered with iSpot.tv to bring you a weekly chart we call Promo Mojo: exclusive data showing the top five TV show promos ranked by impressions. These are the shows networks have been promoting most heavily to drive tune-in (our data covers the 7-day period through July 24).
NBC has a major presence at the Democratic National Convention in Philadelphia this week, but the network is already looking ahead to its next tentpole: next month’s Summer Olympics in Rio. Though promos from Food Network for Cooks vs. Cons and USA Network for its Emmy-nominatedMr. Robot take the No. 1 and No. 2 spots in our ranking based on their ad impressions (146.0 and 142.9 million, respectively), a high-spirited Summer Olympics promo from NBC, in third place with just under 125 million impressions, is tops in terms of estimated in-network value, thanks to high-profile placements in pricier time slots.
Related: USA Network Gives Mysterious ‘Mr. Robot’ Promo Major Push
1) Cooks vs. Cons, Food Network
Impressions: 146,021,707
Imp. Types: National 89%, Local 8%, VOD/OTT 3%
Avg. View Rate: 86.07%
The smarter way to stay on top of broadcasting and cable industry. Sign up below
In-network Value: $1,146,962
Out-of-network Est. Spend: $270,399
2) Mr. Robot, USA Network

Impressions: 142,925,272
Imp. Types: National 74%, Local 10%, VOD/OTT 16%
Avg. View Rate: 89.07%
In-network Value: $1,378,871
Out-of-network Est. Spend: $228,482
3) Rio 2016 Summer Olympics, NBC

Impressions: 124,962,874
Imp. Types: National 57%, Local 37%, VOD/OTT 6%
Avg. View Rate: 88.88%
In-network Value: $2,389,445
Out-of-network Est. Spend: $0
4) Bizarre Foods, Travel Channel

Impressions: 120,571,342
Imp. Types: National 71%, Local 22%, VOD/OTT 7%
Avg. View Rate: 94.79%
In-network Value: $795,151
Out-of-network Est. Spend: $109,387
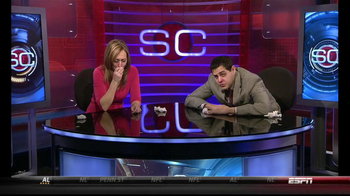
5) SportsCenter, ESPN

Impressions: 110,621,504
Imp. Types: National 98%, Local 1%, VOD/OTT 1%
Avg. View Rate: 97.69%
In-network Value: $1,322,250
Out-of-network Est. Spend: $0
Data provided by iSpot.tv, Real-time Advertising Metrics
Impressions - The total impressions within all US households including National Linear (Live & Time-shifted, VOD+OTT, and Local.
Imp. Types - Impression types tracked include National (Live + Time-shifted), Local, VOD & OTT. See below for further details.
Avg. View Rate - The average view rate across all views of a promo. The average view rate is only calculated on impressions that are viewed from the beginning of the promo.
In-network Value - Estimated media value of in-network promos.
Out-of-network Spend - The estimated amount spent on TV airing time for this promo's spots during a given date range.
National: Live - A national promo which was viewed during live linear television broadcast or same day, via DVR or on-demand.
National: 3 Day Time-shifted - A national promo which was viewed on delay, via DVR or on demand up to 3-days after the original broadcast.
National: 4-7 Day Time-shifted - A national promo which was viewed via DVR between 4 & 7 days after the original broadcast.
National: 8+ Day Time-shifted - A national promo which was viewed via DVR 8 days or more after the original broadcast.
Local - A promo that was aired during a local ad break slot.
VOD - This includes promos that run in on-demand content past three days (i.e. do not contain the linear promo load)
OTT - On-demand streaming content (i.e. Hulu, Roku, Fire TV Stick, Chromecast).
