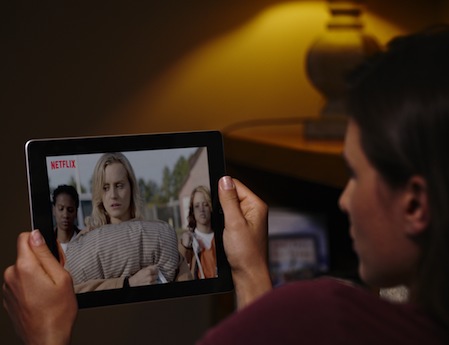
Nielsen: Live TV Viewing Drops, More Homes Get SVOD

The smarter way to stay on top of broadcasting and cable industry. Sign up below
You are now subscribed
Your newsletter sign-up was successful
American viewers watch less live TV, while more households have access to streaming video on demand services like Netflix, according to a first look at Nielsen’s newly released third-quarter Total Audience report.
The trends are the result of increasing availability of programming on an array of digital devices, not all of which is included in the ratings used by the TV industry, including commercial ratings used to sell advertising time.
That’s why Nielsen is in the process of introducing Total Audience Measurement, which it says will include as much viewing on as many devices as possible.
The new report includes a number of interesting findings. For one thing, penetration of streaming video on demand—largely cited for the decline in traditional TV viewing, is about to eclipse penetration by digital video recorders—the device blamed for hurting advertising by making commercials easy to skip. SVOD penetration rose to 46% from 40%. DVR penetration was flat at 49%.
“We're reaching sort of a crossing point for those numbers,” said Nielsen senior VP, audience insights, Glenn Enoch.
Live viewing per day among adults 18 years or older was 4 hours and 7 minutes, down 2% from 4 hours and 13 minutes in the third quarter of 2014 and 4 hours and 27 minutes two years earlier. Delayed viewing was unchanged at 28 minutes per day. It was 26 minutes per day two years ago. Use of multimedia devices doubled to 10 minutes during the quarter from five minutes a year ago and three two years ago.
But Enoch says that the delayed viewing figure does not yet include all of the video on demand viewing of traditional TV shows enabled by cable operators, telcos and satellite services. Those providers report that VOD usage is growing fast.
The smarter way to stay on top of broadcasting and cable industry. Sign up below
Nielsen does not yet measure Netflix and the other streaming video services specifically, but it found that users of multimedia devices were spending more time with them. They used multi-media devices for 49 minutes per day in Q3 of 2015, compared to 43 minutes in 2014 and 39 minutes in 2013. Time spent using apps on smartphones also rose to 1:37 in 2015 from 1:33 in 2014.
Enoch also notes that device usage varies by income level.
While 29% of households with incomes of $25,000 or less have DVRs, 76% of households with incomes of $75,000 and up have one. The story is similar with enabled smart TVs, as 9% of those in the $25,000 and lower bracket have them, while 29% of those in the more affluent bracket own them, and with multimedia devices, which are in 12% of the downscale homes and 34% of more upscale homes.
The interesting part of the analysis is that the lower-income homes become heavier users of the devices they buy than do those in the higher income homes. In the homes with incomes of $25,000 or less, 211 minutes is spent per month watching live and DVR time shifted TV, while in households with incomes of $75,000 or more, just 113 minutes is spent watching TV. In lower-income households with a multimedia devices, 39 minutes is spent with that devices, compared to 18 minutes in homes with incomes of more than $75,000. Homes in the lower income bracket with smart phones spend 57 minutes a month with the devices, much more than the 44 minutes spent with smartphone in the higher-income households.
“The thing we were most surprised to find was that lower-income households used all devices and all platforms more, if they used them at all, than the higher income households, even though higher income houses were more likely to have devices and multiple devices and ownership of newer devices,” Enoch said.
Enoch noted that high income households don’t have to make choices about which devices they own. With lower-income households “they’re concentrating all their usage on the devices they have. It’s not use it or lose it, it’s use it because you’ve put your hard-earned money into it,” he said. “I wish we had a market break for frugal consumer, so we could see what frugal people who might have money and people who are not so frugal and have money, how they’re different in their media habits.”
The Nielsen report puts the number of pay-TV homes at 100 million, down from 101 million a year ago, a smaller drop than one would imagine based on the headlines about cord cutting. Wired cable homes fell to 52.3 million from 53.6 million a year ago, while telcos picked up 135,000 subscribers to have a total of 13.5 million. Satellite, with 34.6 million subs, showed a small decline.
The number of households with broadcast only rose to 12.8 million from 12.2 million and the number of households with broadband only rose to 3.6 million from 2.8 million.
Jon has been business editor of Broadcasting+Cable since 2010. He focuses on revenue-generating activities, including advertising and distribution, as well as executive intrigue and merger and acquisition activity. Just about any story is fair game, if a dollar sign can make its way into the article. Before B+C, Jon covered the industry for TVWeek, Cable World, Electronic Media, Advertising Age and The New York Post. A native New Yorker, Jon is hiding in plain sight in the suburbs of Chicago.

