Nielsen: Streaming Grows to 25% of TV Usage in 2Q
TV households with pay-TV down to 76.3%

The smarter way to stay on top of the multichannel video marketplace. Sign up below.
You are now subscribed
Your newsletter sign-up was successful
There's more evidence that the TV world is turning to streaming from pay TV.
Streaming grew to more than 25% of total TV minutes viewed in the second quarter, according to Nielsen’s latest Total Audience Report.
In Nielsen’s last report, streaming represented 19% of TV usage in the fourth quarter.
At the same time, live TV consumption dropped to 3 hours and 43 minutes per day in the first quarter, down from 3:53 a year ago and 4:10 two years ago.
Nielsen said that the share of TV households with a pay TV subscription fell to 76.3% from 78.1% a year ago. The share of people with SVOD subscriptions rose to 74% from 70% and the 77% of people owned internet enabled TV-connected devices, up from 72%.

“COVID-19 has catapulted streaming to become the present and future of content creation. Today, it accounts for 25% of our collective time spent with the television among streaming capable homes. Streaming has also taken hold among consumers 55 and older, often a technological sign of ubiquity and resolve,” said Peter Katsingris, senior VP, audience insights at Nielsen.
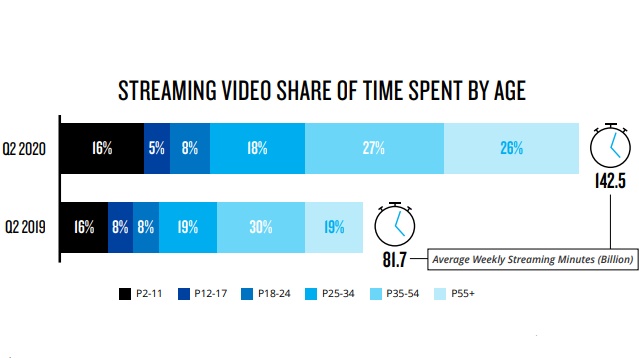
According to the new Total Audience Report, Americans watched an average of 142.5 billion weekly streaming minutes in the second quarter, compared to 81.7 million hours in the second quarter of 2019.
The smarter way to stay on top of the multichannel video marketplace. Sign up below.
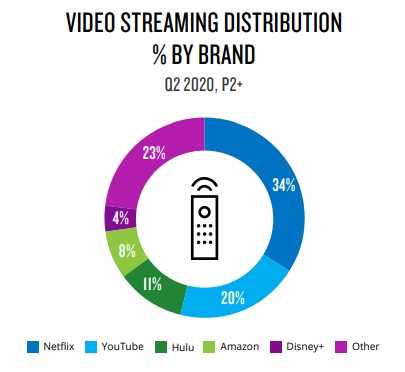
Netflix has the largest share of streaming viewing at 34%. Netflix is followed by YouTube at 20%, Hulu at 11%, Amazon at 8%, Disney Plus at 4% and “other” with 23%. In the fourth quarter, Netflix had a 41% share, followed by YouTube at 21% Hulu at 12% and Amazon at 8%. Disney Plus had just launched.
Nielsen found that viewers of all ages are streaming. Consumers 55 and up--the heaviest TV viewers--now account for 26% of all streaming, up from 19% a year ago.
The study also found that 25% of those surveyed have increased the number of video services they subscribe to.
While consumption of live TV and time shifted TV was down, use of digital devices grew. People spent 3:46 per day using apps or the web of their smartphones, up from 3:01 last year. At the same time use of the internet via a connected device rose to 48 minutes from 35 minutes a year ago. Usage of the internet on a computer and on a tablet were also up.
Live and time shifted TV’s share of media time fell to 35% from 39%, while TV connected devices rose to 9% from 8%. The big gainer was smartphones, which rose to a 30% share from 26%.
Looking at video, live plus time shifted TV fell to 4 hours and 16 minutes from 4:27 in the first quarter a year ago, while usage of TV-connected devices rose to 1:06 from 54 minutes. Overall the average amount of time spent watching video rose 10 minutes to 5 hours and 56 minutes.
The percentage of the 251 million American homes with traditional cable fell to 68.6% in July from 72.7% a year ago. vMPVDs’ share rose to 7.7% from 5.4%. Over the air households were unchanged at 13.4% and broadband-only homes rose to 10.3% from 8.6%.
Jon has been business editor of Broadcasting+Cable since 2010. He focuses on revenue-generating activities, including advertising and distribution, as well as executive intrigue and merger and acquisition activity. Just about any story is fair game, if a dollar sign can make its way into the article. Before B+C, Jon covered the industry for TVWeek, Cable World, Electronic Media, Advertising Age and The New York Post. A native New Yorker, Jon is hiding in plain sight in the suburbs of Chicago.

