No Nielsen? Here’s How Networks Can Use Other Measurement Tools
The smarter way to stay on top of broadcasting and cable industry. Sign up below
You are now subscribed
Your newsletter sign-up was successful
CBS and Nielsen have been in the news recently as stalled renewal negotiations led CBS to allow its contract to lapse at the end of 2018. The network publicly expressed frustration, calling out Nielsen for not making sufficient “progress” in offering “complete and accurate measurement across platforms.”
On Jan. 7, Nielsen said that it’s adding OTT and mobile to its Total Ad Ratings data. It remains to be seen if that will be enough to placate CBS. Meanwhile, the standoff has a lot of industry players thinking about the measurement ecosystem beyond Nielsen.
Outside of the typical comparisons to Comscore or Kantar, there is actually a lot out there for a network looking to put together a 360-degree view into viewer behavior and advertising performance.
Related: Google Gives Nielsen a Cross-Platform Boost
Smart TV Offers Real-Time Granularity at Scale
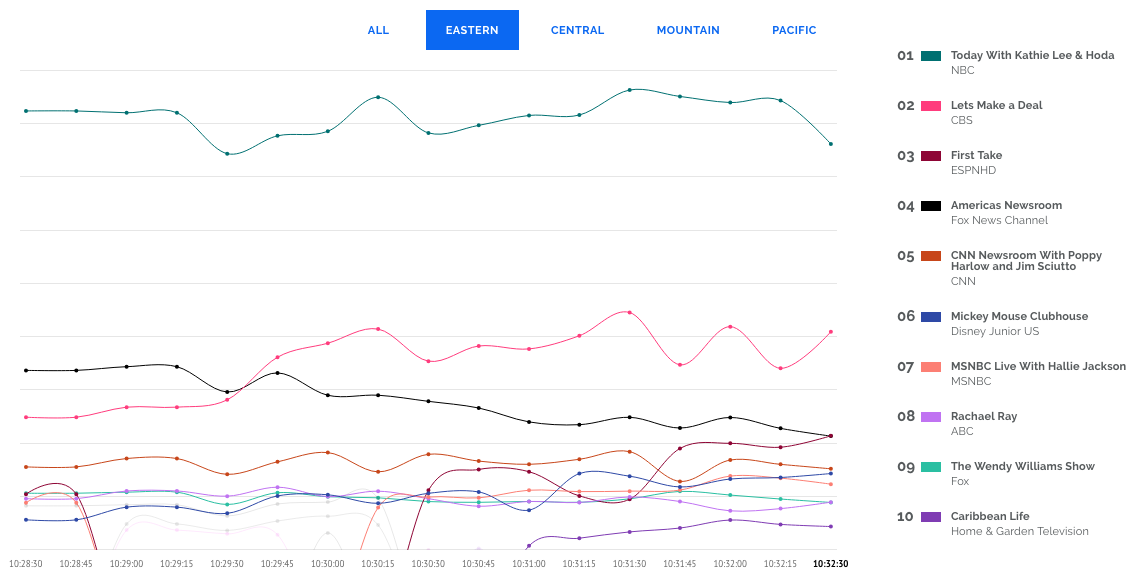
First off, viewership data down to a second-by-second look can be found using Inscape, the TV data company with glass-level insights from a panel of more than 9 million smart TVs and devices. The chart below, accessible on Inscape’s website here, shows tune-in for the top 10 shows, refreshed every few seconds.
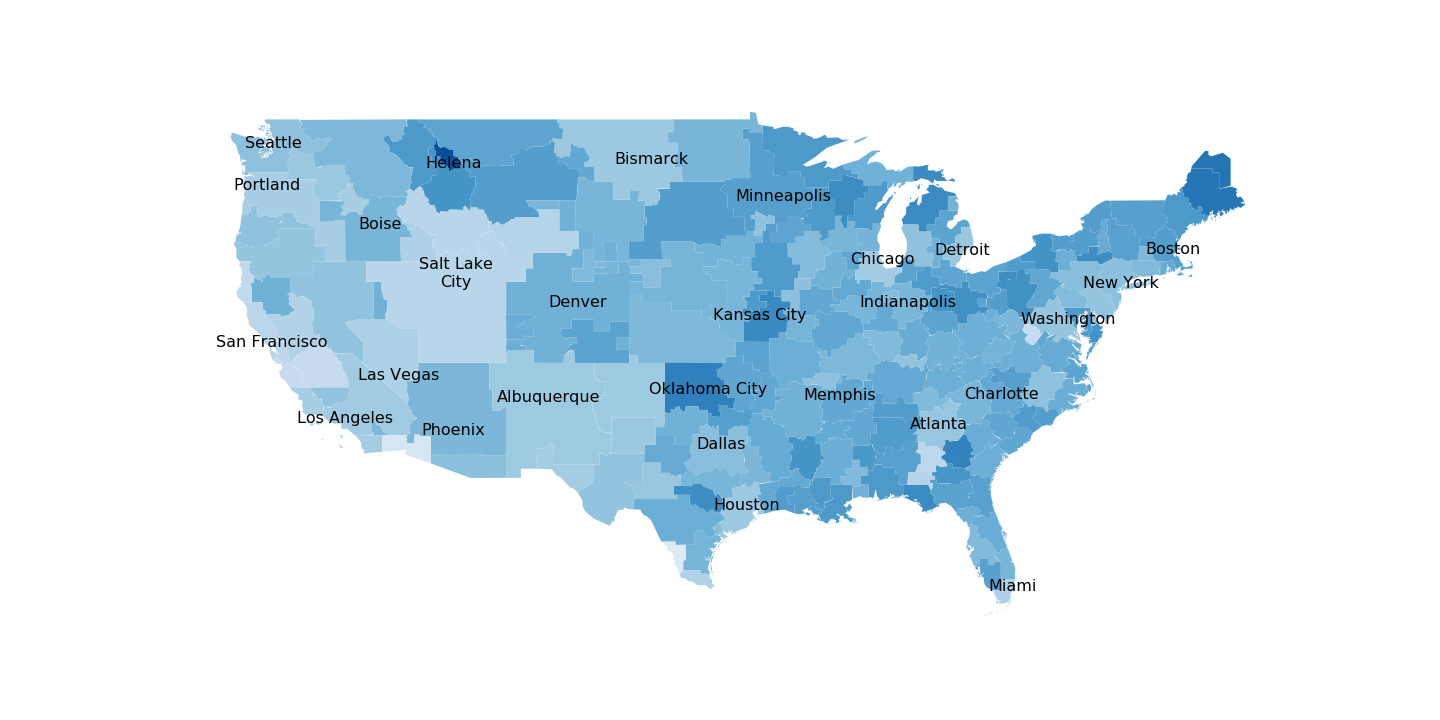
Inscape can also show DMA tune-in for programs and channels — below is a look at geographical viewership for CBS since Oct. 1, 2018. (On the heatmap, the darker the color, the more households were tuning in.)
The smarter way to stay on top of broadcasting and cable industry. Sign up below
Going further, we can examine what other shows and networks were being watched by CBS viewers during the same time frame. Predictably, sports and the NFL in particular top the list.


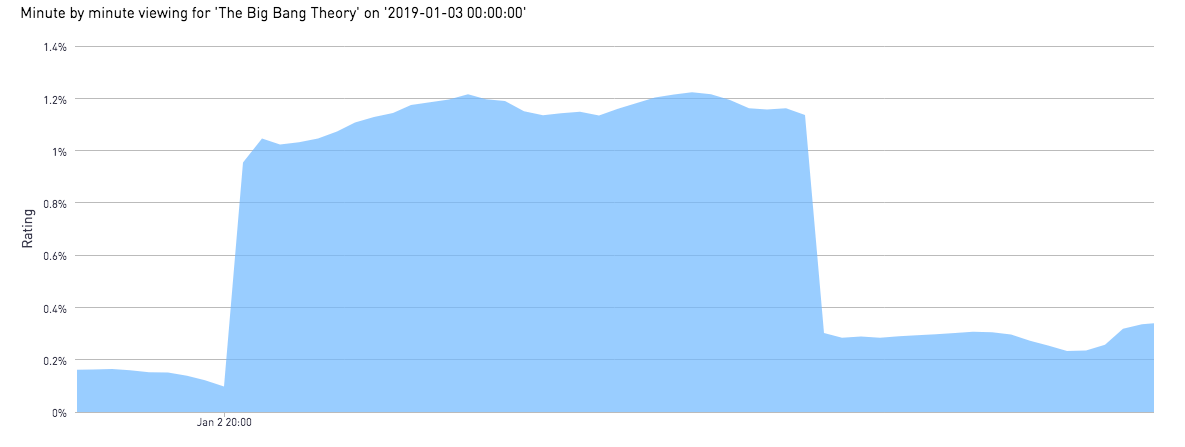
Diving even deeper, we looked at trends for the most recent episode of CBS’ The Big Bang Theory, including minute-by-minute tune-in. Over the course of the episode, viewership rose slightly — a good indicator of an engaged audience that doesn’t channel surf. (The slight dips along the way may correspond to commercial breaks, when viewers are more likely to surf around to see what else is on, but in this case it appears that people kept coming back to see what Sheldon and the gang were up to.)
And though Nielsen and others take great care to be representative with data, the distribution of million of TVs across the country in all DMAs and all different rooms proves to align with the U.S. census.
Measuring Ad Performance Like Digital
Meanwhile, insights from iSpot.tv, the real-time TV ad measurement company with attention and conversion analytics, can give a detailed view into advertising performance on CBS.
Much like how NBCUniversal announced the ability to sell TV advertising based on the business outcomes ad airings generate, CBS can integrate ad tracking with performance-based selling.
It can also use TV device impressions as a metric for those still buying based on reach. For example, CBS can easily discover that since Oct. 1, commercials on its network have generated nearly 111.9 billion TV ad impressions and ads have an iSpot Attention Score (a measure of the degree to which ads are viewed without an interruption such as channel-surfing or tuning out entirely) of 89.79.
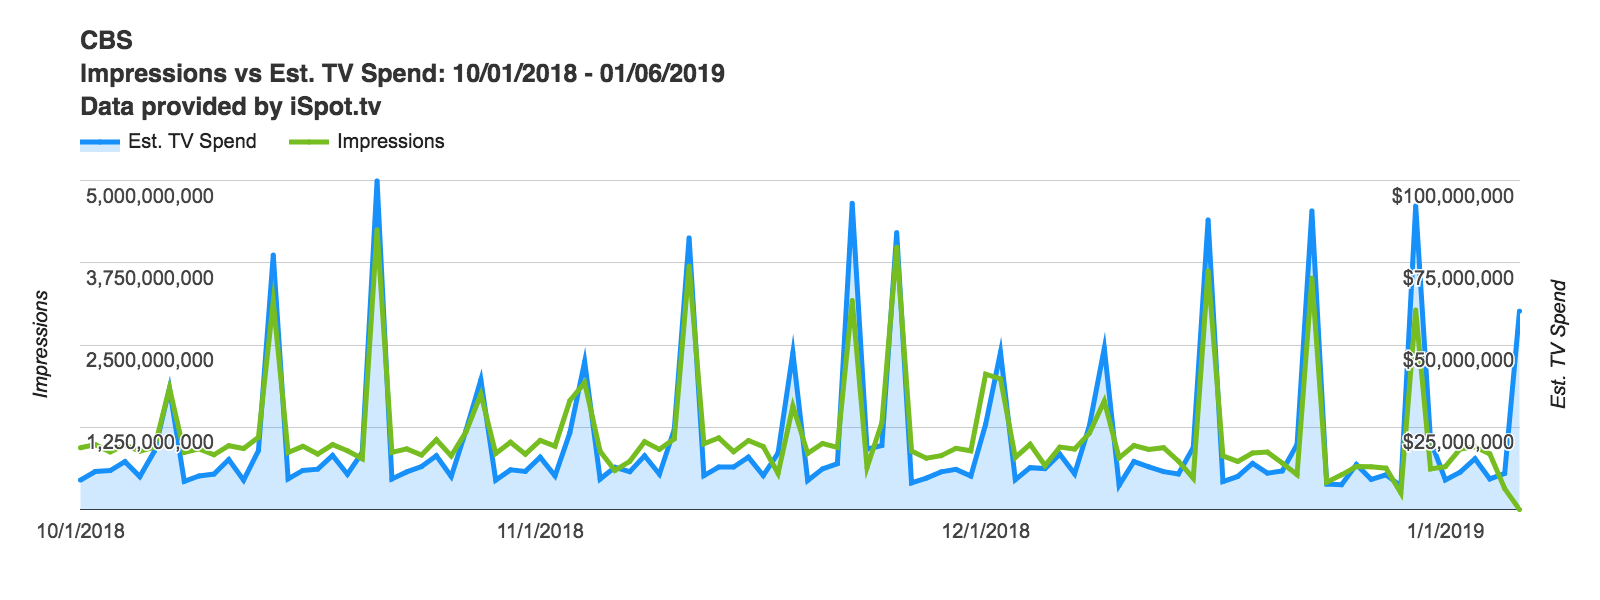
The volume of ad exposures is easy to map out by genre, show, day part or by brand or industry. Over time CBS ad impressions look like this (spiking most notably during football-filled Sundays). The vast majority of ad impressions (over 90%) occurred live or during the same day.
On the social video front, Tubular Labs can provide analytics around the CBS properties on YouTube, Facebook, Twitter and other platforms. CBS has slightly prioritized posting to YouTube (51.1K videos) over Facebook (30.6K) and Twitter (23K), but its two most-watched videos since Oct. 1 were both posted to Facebook. In first place is “FedEx driver stops to fold American flag,” with 37.3 million views — 33.1 million of which occurred in the first seven days, according to Tubular’s V7 rating.
“Police officers stop to salute soldiers returning home from Afghanistan” takes second place with 33.6 million views and a Tubular V7 rating of 21.8 million.
Its two most-watched YouTube clips both come from The Late Late Show with James Corden and feature the viewer favorite “carpool karaoke.” This is a smart strategy from CBS to share widely popular segments from the show on social, broadening its reach beyond just who tunes into the broadcasts. In first place is the carpool karaoke with Migos with 29 million total views and a V7 rating of 15.7 million. Second is Cardi B’s carpool karaoke with 24.7 million views and a V7 rating of 19.8 million.
[embed]https://www.youtube.com/watch?v=irVIUvDTTB0[/embed][embed]https://www.youtube.com/watch?v=HOeSwjhSGoM[/embed]
Measuring Viewers’ Emotional Investment
These days it’s not just about pure tune-in — networks need to know what programs are resonating emotionally with viewers. Insights from emotion measurement AI company Canvs reveal that for CBS, after NFL and college football, 60 Minutes, The Late Show With Stephen Colbert and Survivor were three of the shows that generated the most Emotional Reactions from viewers since Oct. 1.
