Tablets, OTT Devices, Smartphones, Set-Tops Top Among Video’s Money Makers
The smarter way to stay on top of the multichannel video marketplace. Sign up below.
You are now subscribed
Your newsletter sign-up was successful

The desktop PC isn’t dead, but it continues to cede online video share to devices such as tablets, over-the-top streaming devices, traditional set-top boxes, and smartphones.
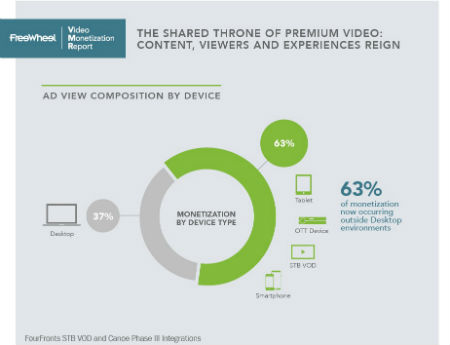
About 63% of video monetization occurs outside desktops, according to the Q1 2016 Video Monetization Report from FreeWheel, the Comcast-owned ad-tech company.
Programmers that offer VOD content with ad insertion on set-tops also saw a 20% boost in volume in Q1, making it the second largest device type in terms of ad delivery, FreeWheel said.
And here’s more fodder for the binge-viewing trend -- the report also found that the audience, by program category, is four times larger when all episodes of a series are available on one location versus a more limited rotational library.
“Full Library programming achieved four times the reach, based on volume of unique viewers over the course of a quarter, and a +52% increase in frequency measured by episodes consumed per viewer, compared to that of a Rotational Library show,” FreeWheel said in the report. “Viewers are dictating that they want an end-to-end solution to watch and binge their favorite programming.”
On the TV Everywhere front, the study found that 72% of all “TV-style” viewing is now occurring via authentication – when viewers enter their MVPD credentials to access long-form and live streaming content.
“After 13 straight quarters of growth, it is impossible to refute that TVE products have not only cemented their popularity with subscribers but also expanded the footprint of the New Living Room to ever new screens,” FreeWheel said.
The smarter way to stay on top of the multichannel video marketplace. Sign up below.
Notably, authenticated viewers also see an average of 129% more ads per day than non-authenticated viewers, an indication that those viewers are more embedded in the pay TV ecosystem.
Entertainment content now represents 55% of all ad views across genre.
FreeWheel said ad completion rates averaged 85% in Q1. Ad completion rates were highest on OTT devices (85%), compared to tablets (85%), desktops (84%), and smartphones (78%).
Live content saw the biggest rise in ad viewing growth (up 43% year-over-year) compared to long form VOD (20 minutes or more), up 33%, and short-form VOD (10 minutes or less), up 14%.
