Three TV Data Takeaways from the 2018 World Series

The smarter way to stay on top of broadcasting and cable industry. Sign up below
You are now subscribed
Your newsletter sign-up was successful
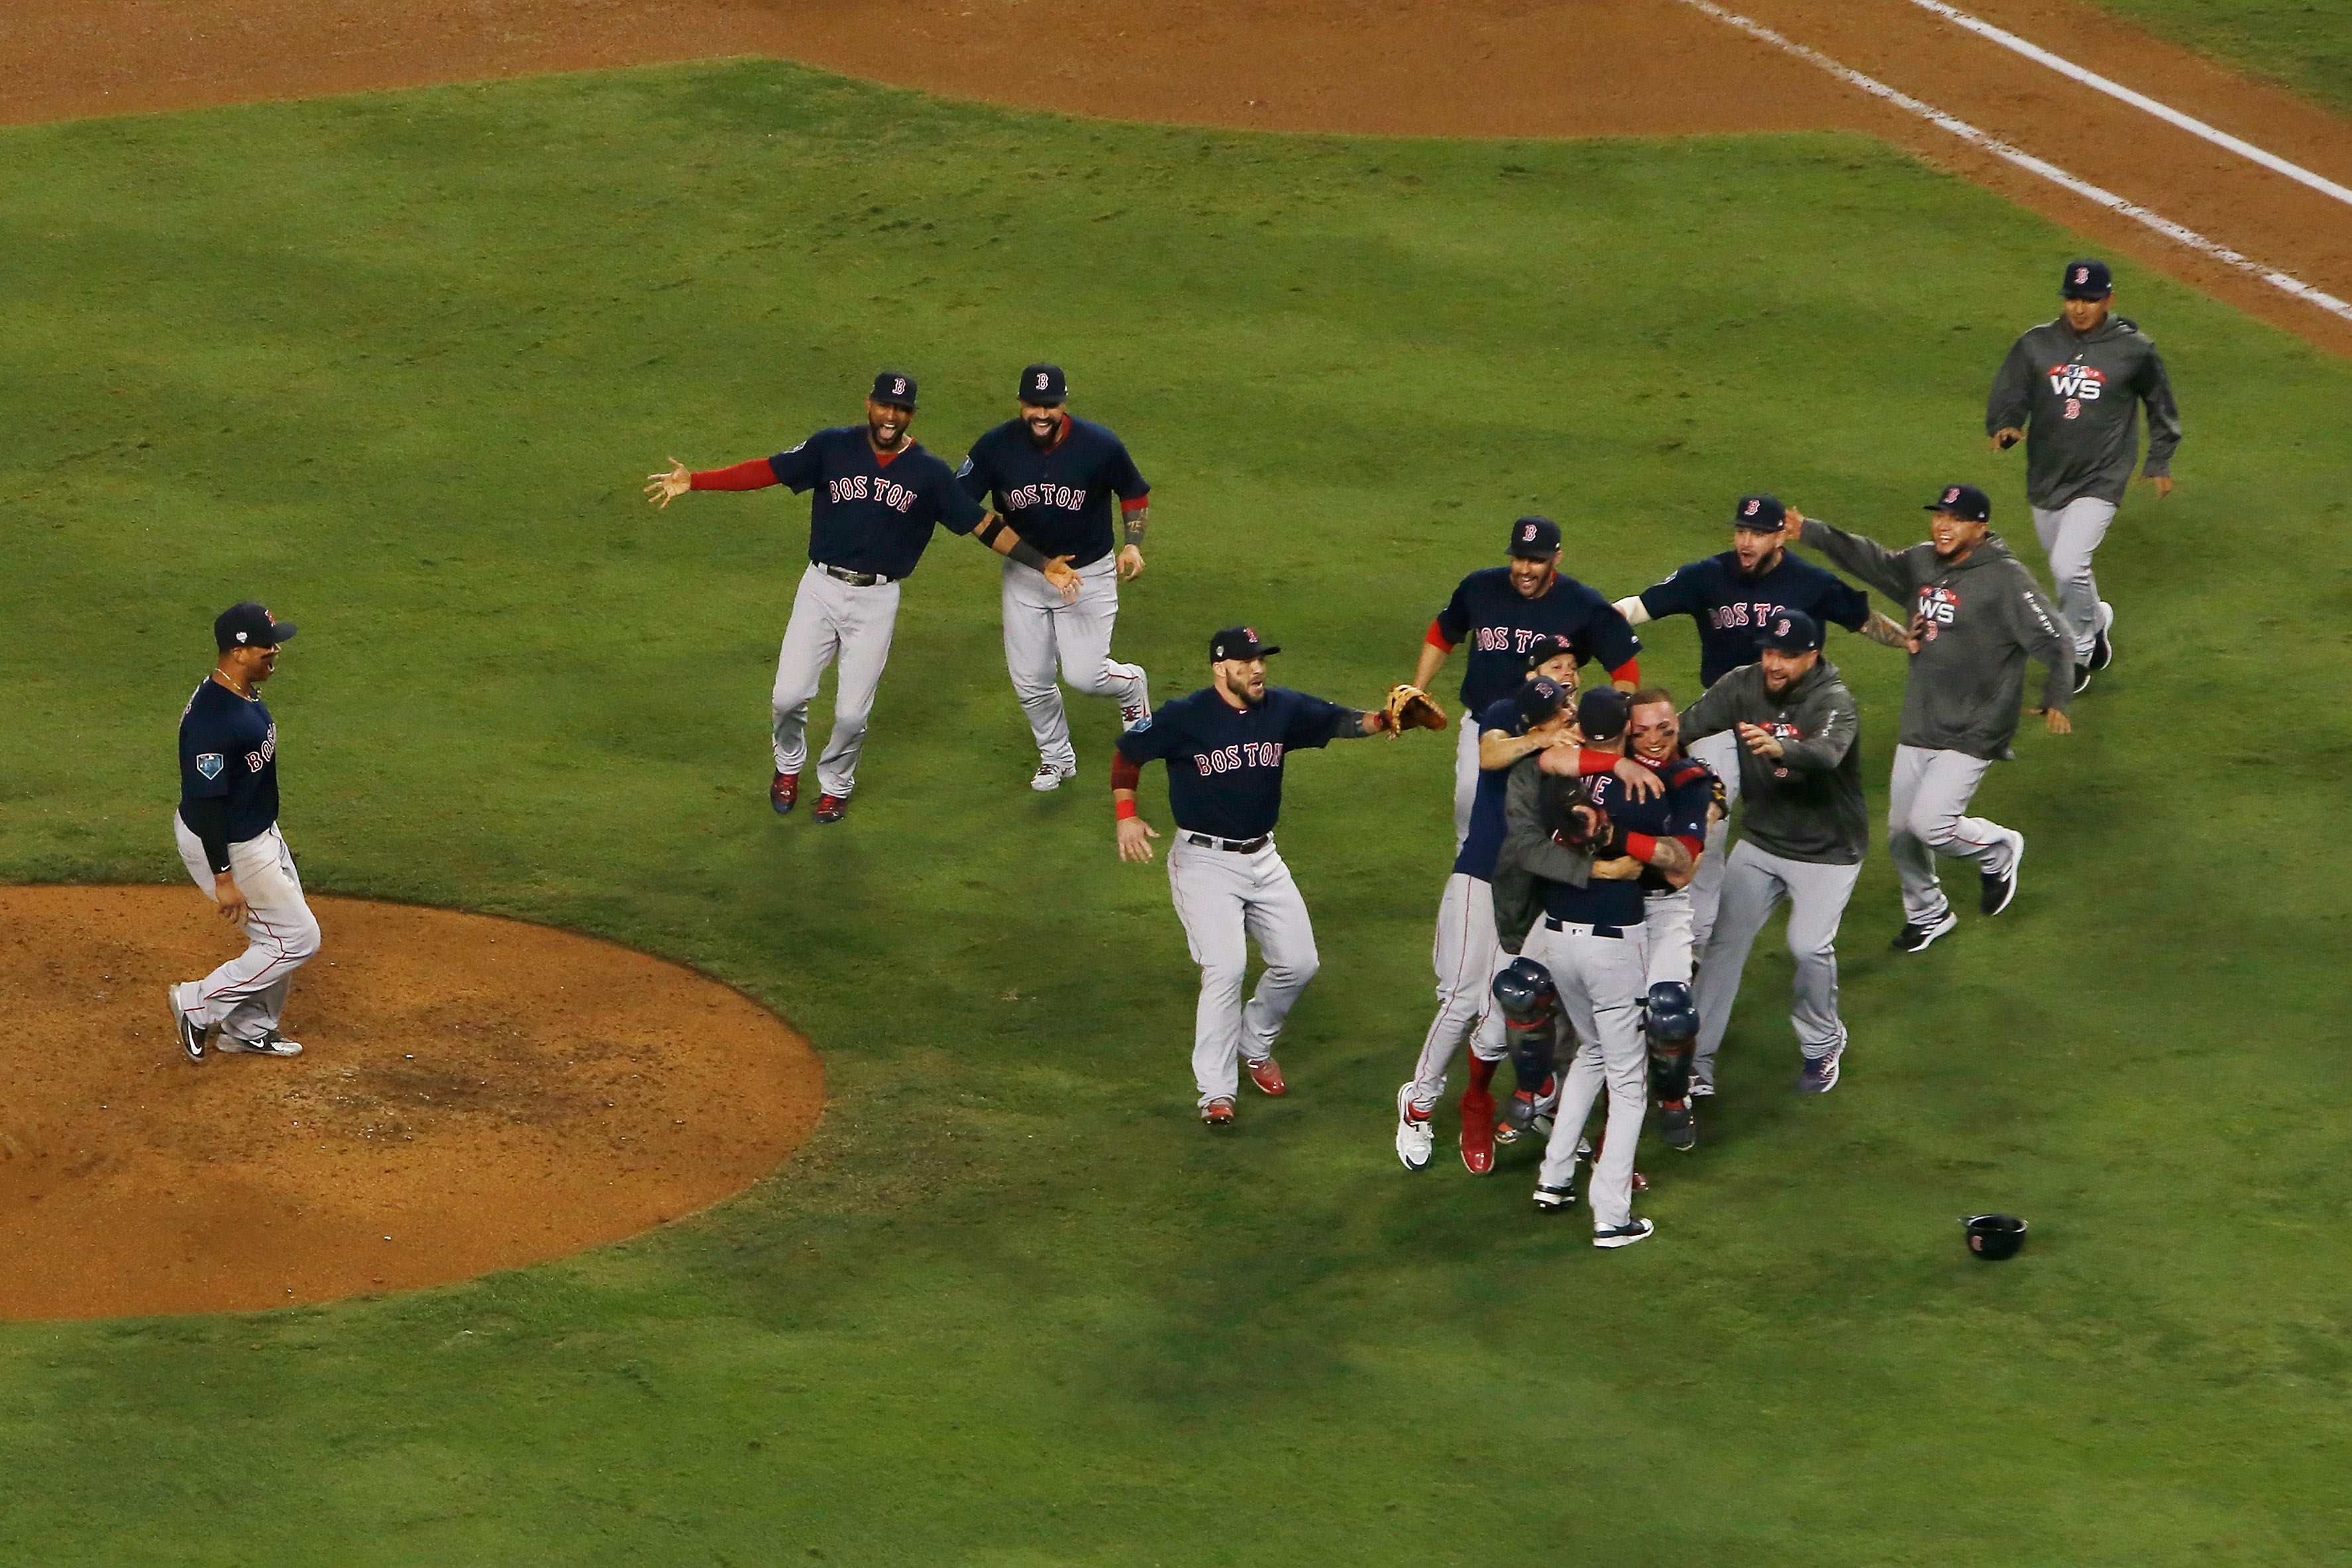
The Boston Red Sox won the team’s fourth championship in 15 years on Sunday, beating the Los Angeles Dodgers 5-1 in game five and winning the World Series four games to one.
While the series fell short of last year’s thrilling seven games, the matchup between two of Major League Baseball’s “biggest” teams still made for some notable opportunities for television advertisers on Fox. We partnered with Inscape, iSpot.tv and Canvs to share three of the biggest takeaways from TV advertising and audience data below:

Game Three’s Marathon Couldn’t Hold Viewers Forever
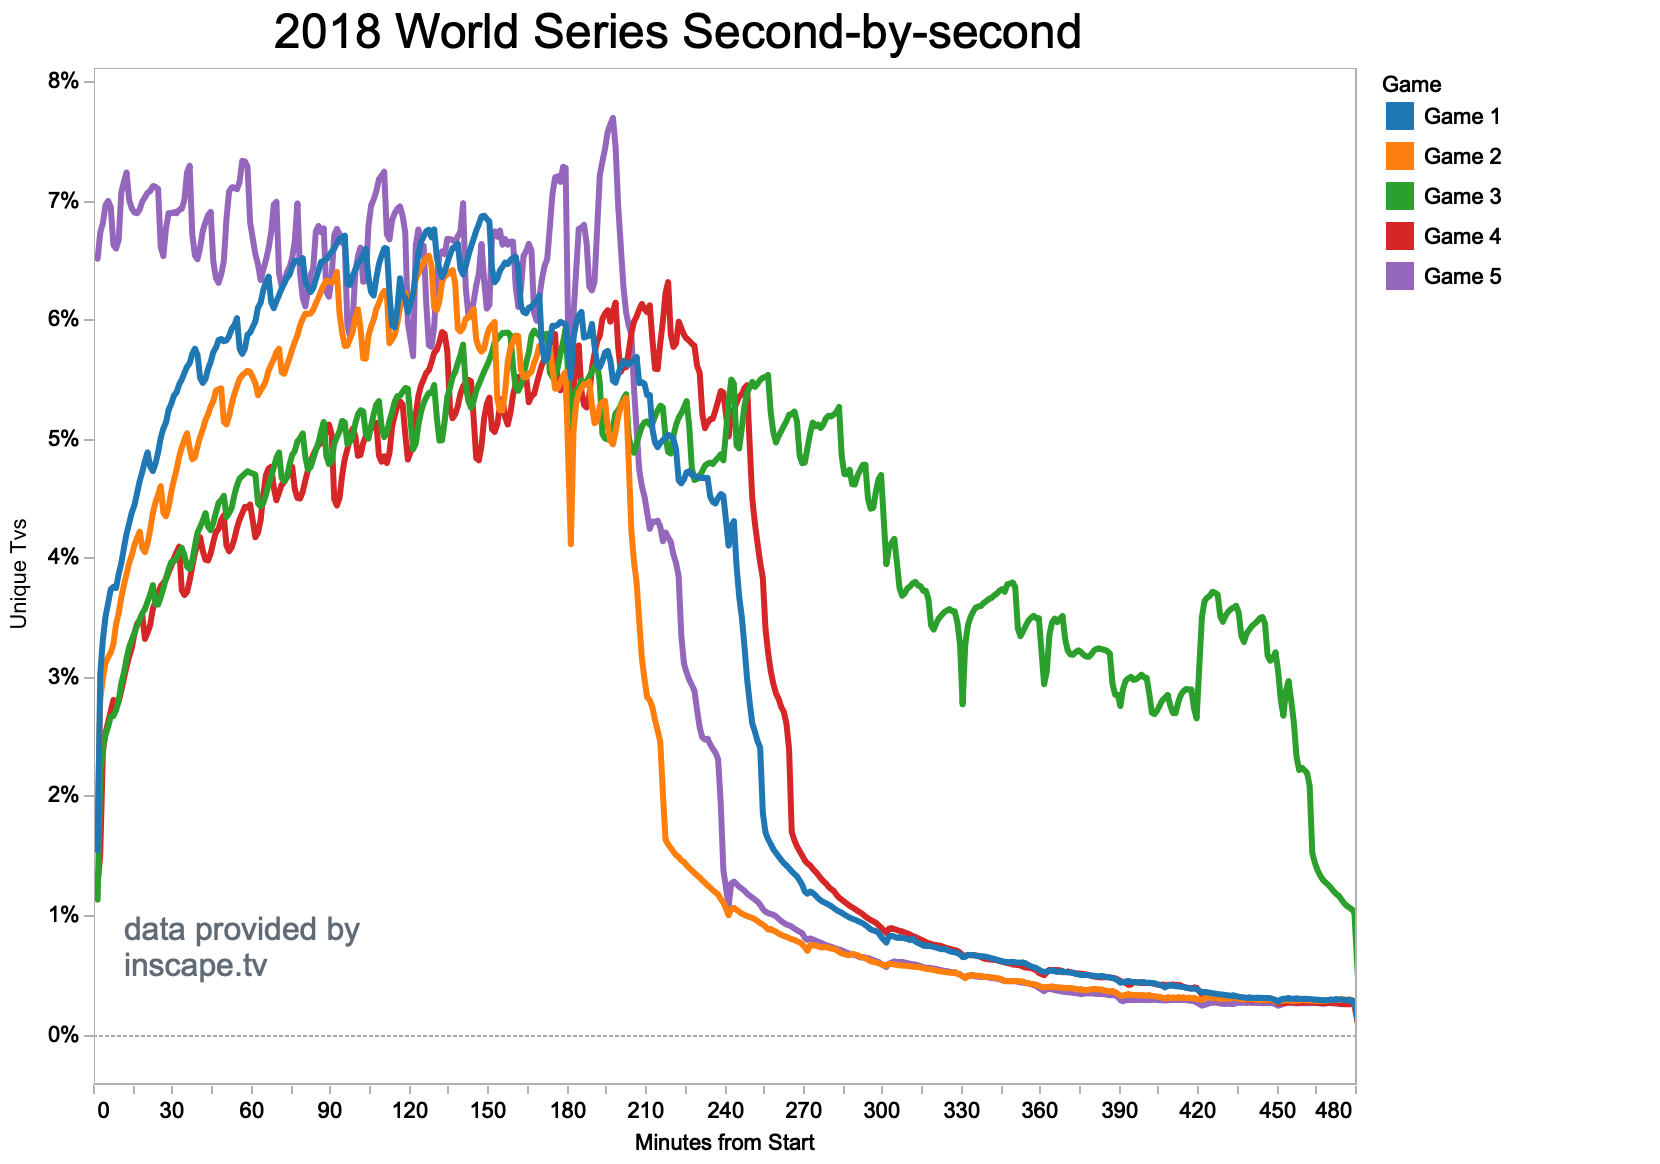
With a bicoastal matchup between Boston and Los Angeles, no start time — especially on weekdays — was going to work for everyone. Based on the graphic above provided by Inscape, the TV data company with glass-level insights from a panel of more than 9 million smart TVs and devices, tune-in mostly started low and then rose over the course of the game. Part of this is likely due to the 5 p.m. PT start, which made it tougher for West Coast fans to catch the early innings before getting home from work.
There were exceptions to some of the prevailing trends, though. For the Red Sox’s series-clinching game five win, fans showed up right from the start and viewership rose over the course of the game, hitting a peak near the conclusion.
Related: Fox and YouTube TV Try Fresh Pitches in World Series
Game three’s 18-inning marathon also provided some unique insights: similar to other games, viewer numbers rose gradually for three hours, but then jumped back up numerous times as both teams looked poised to break open the longest game in World Series history. You see spikes in the 13th inning when both teams tacked on another run to make it 2-2. Then as the game proceeded into the early morning hours for East Coast fans, viewership declined precipitously. The last late spike comes from Max Muncy’s game-winning home run in the bottom of the 18th. Proof that social media and word-of-mouth can have a great effect on tune-in (even after 2 a.m.).
The smarter way to stay on top of broadcasting and cable industry. Sign up below
The game three numbers also tell us something about audiences — or at least this series’ baseball fans — and how long they can sit through even a game with championship implications. Time zones have an effect too. But starting around the three-hour mark, the audience for game three was lower than it was at nearly any other point in the series. And it stayed even lower from the five-hour mark on.
Tech Crashes Advertiser Party
With a lot of World Series advertising going to official MLB sponsors, it’s not surprising that eight of the top 10 advertisers (by total impressions) from the 2017 World Series carried over into the top 10 for 2018, with Amazon Echo and Ford being the two brands to depart the list, according to real-time TV ad measurement company iSpot.tv.
The newcomers, however, made a big splash, with YouTube TV rising from last year’s position of 11th all the way to No. 1 for the 2018 World Series. YouTube TV’s 12 spots generated 285,358,850 impressions throughout the five games. Those commercials had a combined attention score (percentage of an ad played across the TV device) of 90.26 out of 100. YouTube TV’s estimated spend, per iSpot, was $9,957,324 for the entire series.
YouTube TV also dominated in-broadcast promotions (they were the presenting sponsor of the games), making the service's value proposition impossible for viewers to miss.

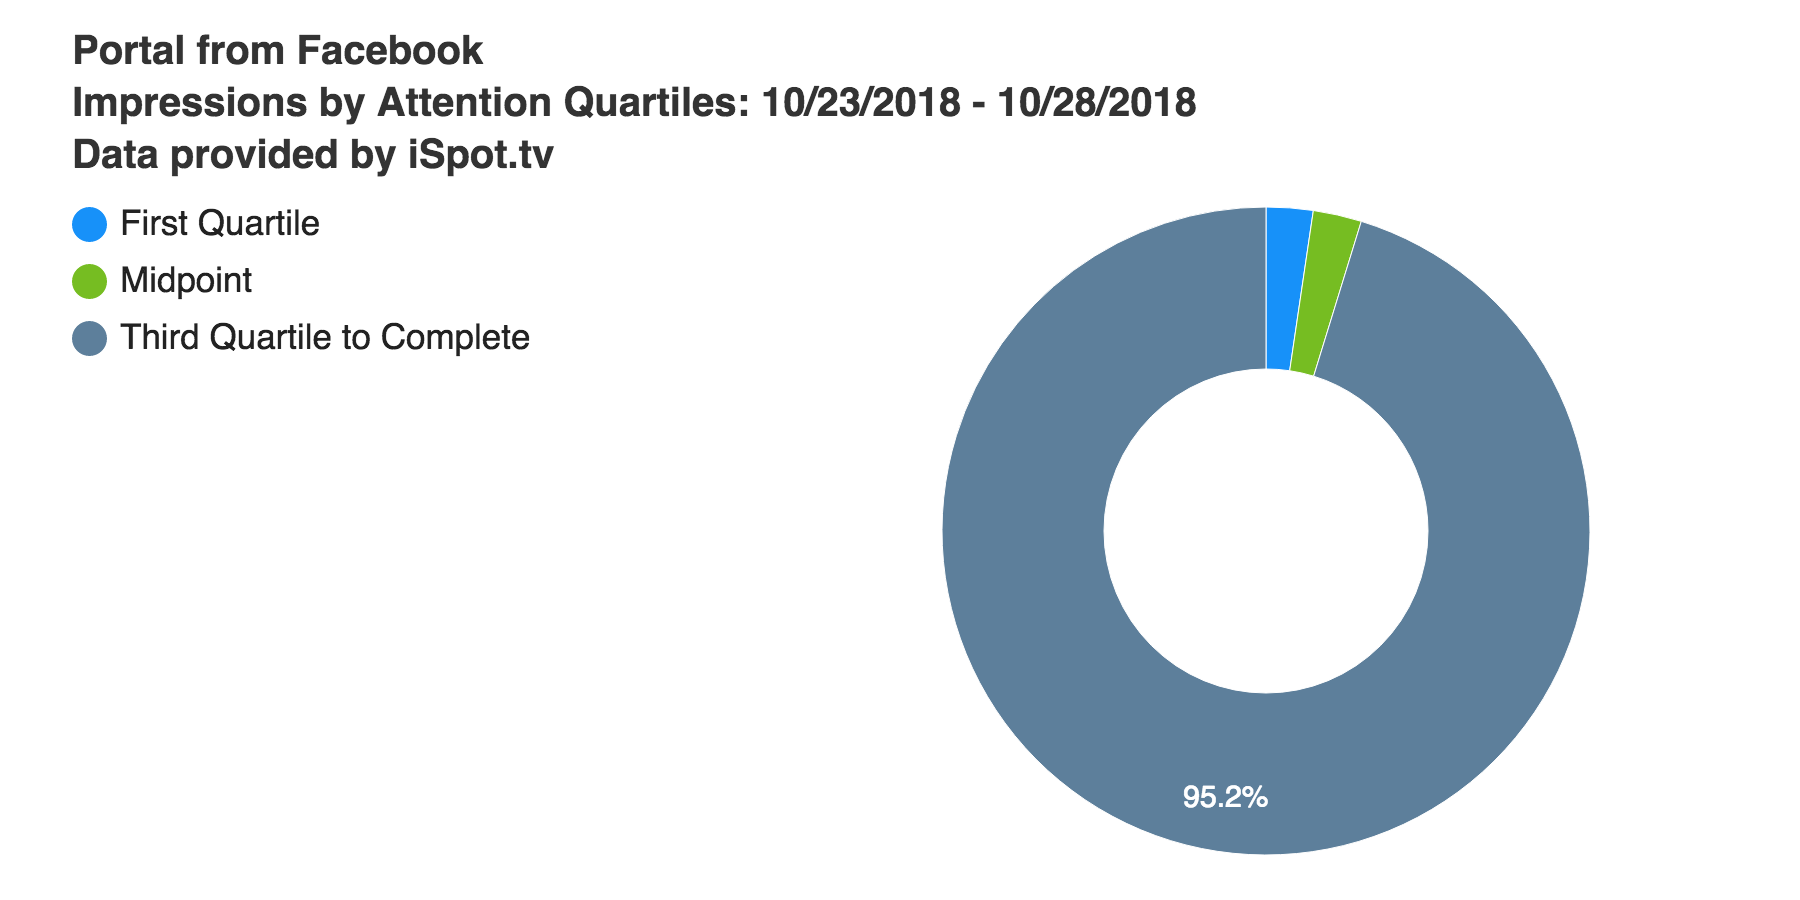
Facebook also showed up plenty, with its Portal spots earning the ninth-most impressions (154,242,916) and Portal's “Feel There” spot having the fifth-most impressions of any individual brand spot. Portal’s two ads, “Feel There” and “Birthday” had a combined attention score of 93.8 for the World Series, and over 95% of viewers watched the spots through at least the third quartile.
Top 10 brand advertisers for the 2018 World Series by impressions:
- YouTube TV (285,358,850)
- T-Mobile (233,557,028)
- Indeed (233,364,547)
- Taco Bell (230,580,447)
- Budweiser (225,975,921)
- Chevrolet (218,442,449)
- Bank of America (194,405,141)
- GEICO (189,117,008)
- Portal from Facebook (154,242,916)
- Progressive (147,083,271)

Red Sox Got the Win, but Dodgers Drove Reactions?
With two large fan bases and some stressful games, the 2018 World Series garnered quite a bit of feedback from social media — especially on Twitter. Emotion measurement and A.I. company Canvs measured Emotional Reactions (ERs) for all five games, and looked at what topics most drove those reactions.
Looking across the five-game series, the majority of those ERs were concentrated on the Red Sox’s series-clinching win on Sunday, Oct. 28, which included 41.2% of the total of 573,443.
Despite Boston winning, however, many of the top ER drivers were actually directly related to the Dodgers. L.A. had 19.6% of all ERs, ahead of Boston’s 15%. Dodgers manager Dave Roberts (2.8%), shortstop Manny Machado (2.2%) and Clayton Kershaw (1.6%) were all next in line in terms of percentage of total ERs. Interestingly, the Dodgers’ Yasiel Puig, who almost played hero in game four with a three-run home run, drove just 0.9% of ERs.
It’s worth noting that although the Dodgers and its top players may have been mentioned more, fans talking about Boston were far more likely to use the team’s official Twitter handle (@RedSox) than the Dodgers’ (@dodgers). Of all ERs, @RedSox received 17.8%, while @Dodgers (which was second overall in terms of Twitter mentions for the series) had just 7.2%.
John Cassillo is an analyst and contributor with TV[R]EV.
