The Top 5 Network Promos Leading Up to the Fall TV Season

The smarter way to stay on top of broadcasting and cable industry. Sign up below
You are now subscribed
Your newsletter sign-up was successful
B&C has partnered with iSpot.tv to bring you a weekly chart we call Promo Mojo: exclusive data showing the top five TV promos ranked by impressions. These are the shows networks have been promoting most heavily to drive tune-in.
To get a deeper sense of promo activity, we took a three-week view (vs. our usual one-week view) of the most-seen promos across all networks starting on Aug. 21 (the end of the Olympics). FX comes out on top, with its promo for Better Things racking up nearly 358 million impressions; Discovery is right behind it, with just under 353 million impressions for its three-night Harley and the Davidsons miniseries—the only thing in our ranking that’s not a new fall show.
Meanwhile, NBC and CBS are putting major promotional muscle behind hourlong dramas (This Is Us and Bull, respectively), while ABC has its money on the sitcom Speechless.
1) Better Things, FX Network

Impressions: 357,718,126
Imp. Types: National 85%, Local 12%, VOD/OTT 3%
Avg. View Rate: 93.02%
The smarter way to stay on top of broadcasting and cable industry. Sign up below
In-network Value: $2,600,512
Out-of-network Est. Spend: $1,435,729
2) Harley and the Davidsons, Discovery Channel

Impressions: 352,979,386
Imp. Types: National 91%, Local 7%, VOD/OTT 2%
Avg. View Rate: 82.04%
In-network Value: $3,836,321
Out-of-network Est. Spend: $1,417,626
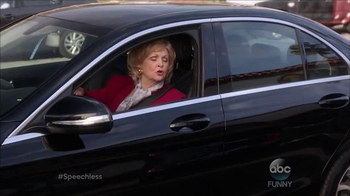
3) Speechless, ABC

Impressions: 325,407,366
Imp. Types: National 74%, Local 20%, VOD/OTT 6%
Avg. View Rate: 89.29%
In-network Value: $5,911,017
Out-of-network Est. Spend: $110,195
4) This Is Us, NBC

Impressions: 316,614,978
Imp. Types: National 69%, Local 24%, VOD/OTT 7%
Avg. View Rate: 90.66%
In-network Value: $5,717,900
Out-of-network Est. Spend: $795,701
5) Bull, CBS

Impressions: 305,027,116
Imp. Types: National 52%, Local 41%, VOD/OTT 7%
Avg. View Rate: 91.65%
In-network Value: $5,487,677
Out-of-network Est. Spend: $61,001
Data provided by iSpot.tv, Real-time Advertising Metrics
Impressions - The total impressions within all US households including National Linear (Live & Time-shifted, VOD+OTT, and Local.
Imp. Types - Impression types tracked include National (Live + Time-shifted), Local, VOD & OTT. See below for further details.
Avg. View Rate - The average view rate across all views of a promo. The average view rate is only calculated on impressions that are viewed from the beginning of the promo.
In-network Value - Estimated media value of in-network promos.
Out-of-network Spend - The estimated amount spent on TV airing time for this promo's spots during a given date range.
National: Live - A national promo which was viewed during live linear television broadcast or same day, via DVR or on-demand.
National: 3 Day Time-shifted - A national promo which was viewed on delay, via DVR or on demand up to 3-days after the original broadcast.
National: 4-7 Day Time-shifted - A national promo which was viewed via DVR between 4 & 7 days after the original broadcast.
National: 8+ Day Time-shifted - A national promo which was viewed via DVR 8 days or more after the original broadcast.
Local - A promo that was aired during a local ad break slot.
VOD - This includes promos that run in on-demand content past three days (i.e. do not contain the linear promo load)
OTT - On-demand streaming content (i.e. Hulu, Roku, Fire TV Stick, Chromecast).
