TV By the Numbers: NBA Playoffs a Slam Dunk for Watch-Time, TV Ad Impressions
With insights from Vizio’s Inscape and iSpot.tv
The smarter way to stay on top of broadcasting and cable industry. Sign up below
You are now subscribed
Your newsletter sign-up was successful
Welcome to our quick snapshot of TV by the numbers for the week of May 24-30, revealing the most-watched shows and networks using glass-level data from Vizio’s Inscape, and the top shows and networks by TV ad impressions with insights via iSpot.tv.
Most-Watched Shows and Networks
Via Inscape, Vizio’s TV data product with glass-level insights from a panel of more than 17 million active and opted-in smart TVs. Data is linear, live TV only and includes all episode types (new and reruns). Rankings are by percent share duration (i.e., time spent watching).
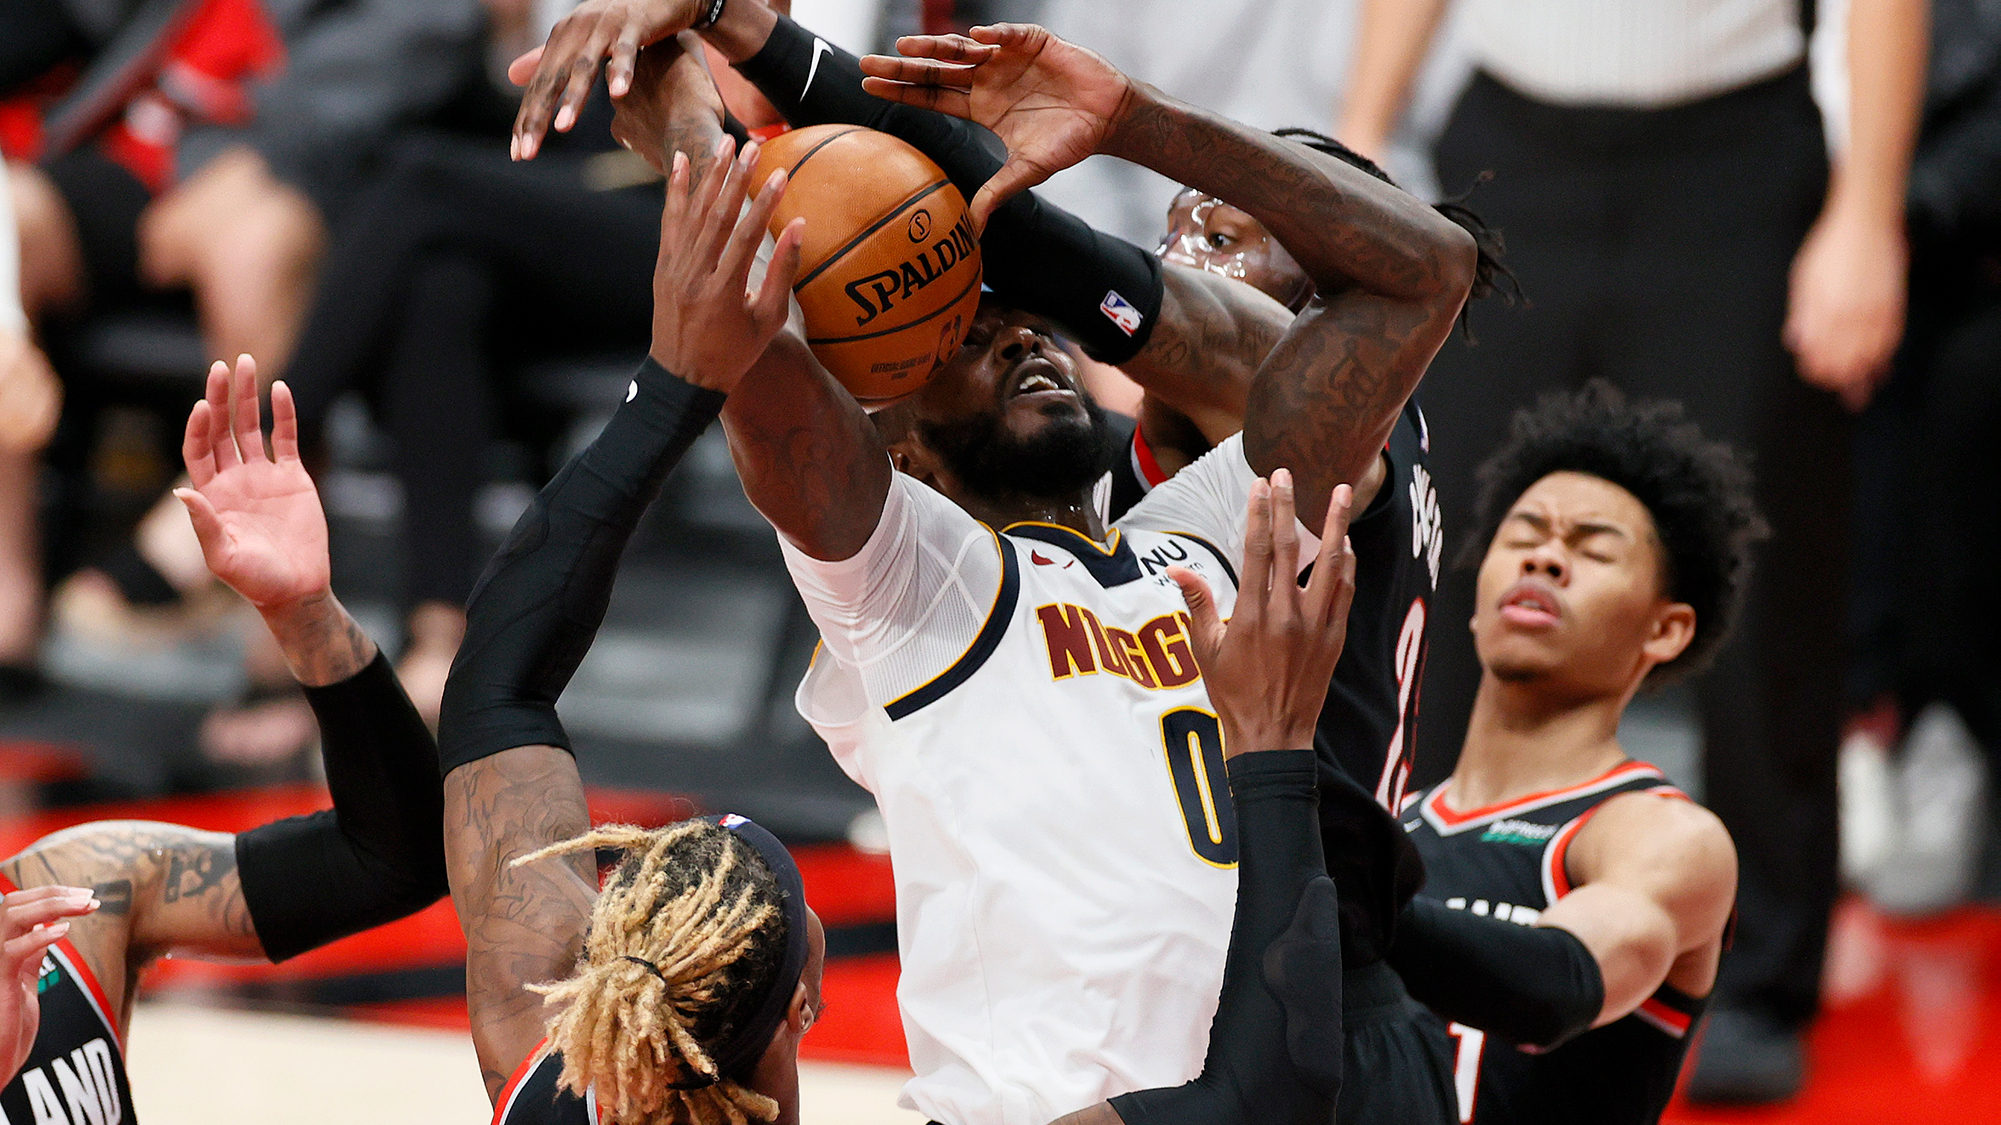
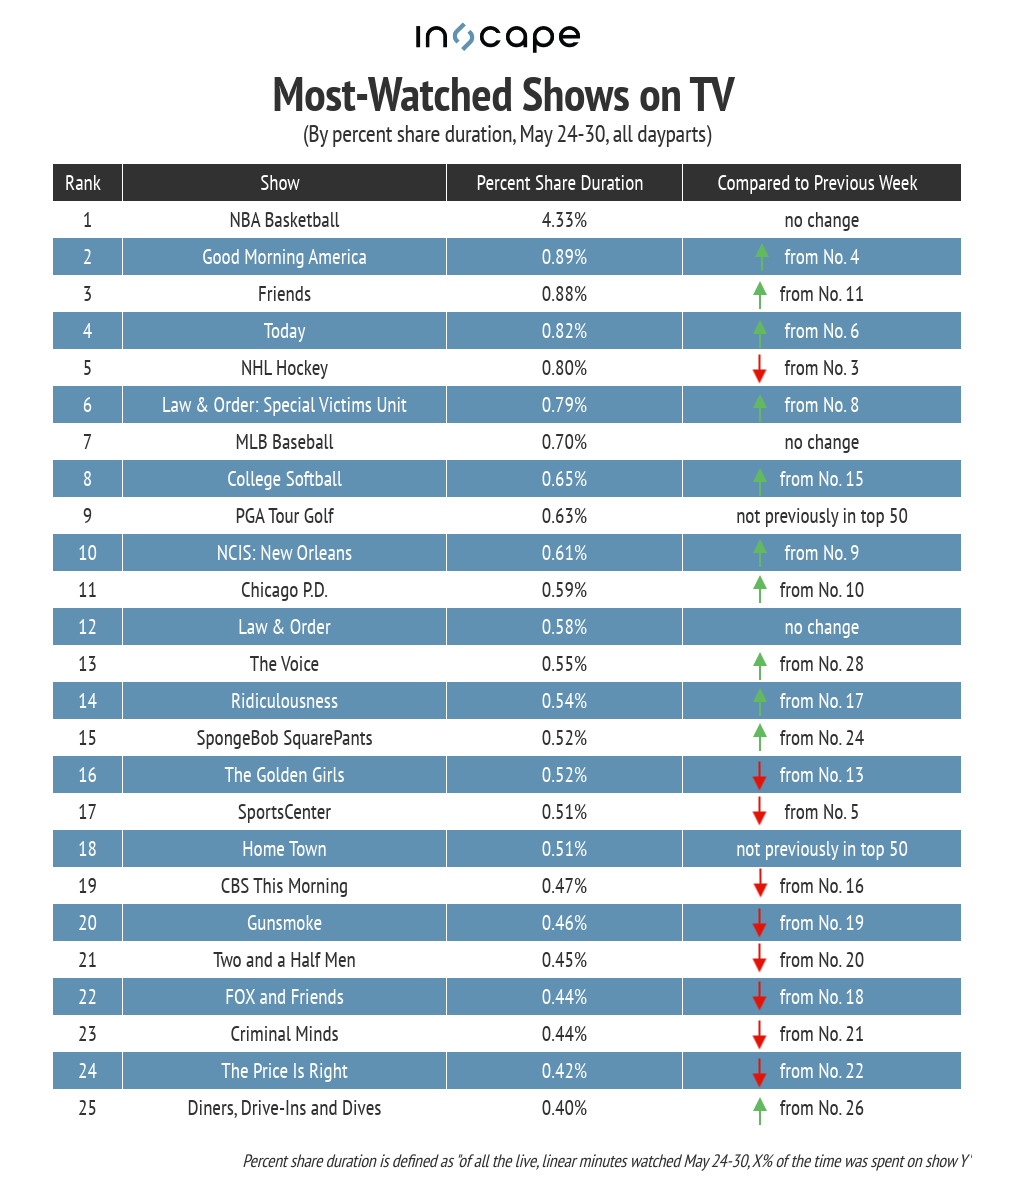
The NBA Playoffs were a fixture on TVs over the last week, as the games stayed in first place for watch-time once again, with a 4.33% share of minutes watched (up from 3.04% the week before). Sports maintained a large presence overall, as five of the top 10 shows by watch-time were sports-related. Beyond the NBA, NHL hockey (0.80%), MLB baseball (0.70%), college softball (0.65%) and PGA Tour golf (0.63%) were the other sports programs in the top 10.
Drafting off the Friends reunion show on HBO Max, reruns of the beloved sitcom jumped all the way to third by minutes watched, with 0.88% of the total; that’s up from No. 11 the previous week. Good Morning America (0.89% of watch-time) was No. 2, followed by Friends, Today (0.82%) and the NHL.
Week-over-week, some of the biggest movers were Home Town (unranked to No. 18), The Voice (up from No. 28 to No. 13) and SpongeBob SquarePants (No. 24 to No. 15). More generally, PGA Tour golf was new to the top 50 this week, but only because it was replacing the PGA Championship (second the week before).
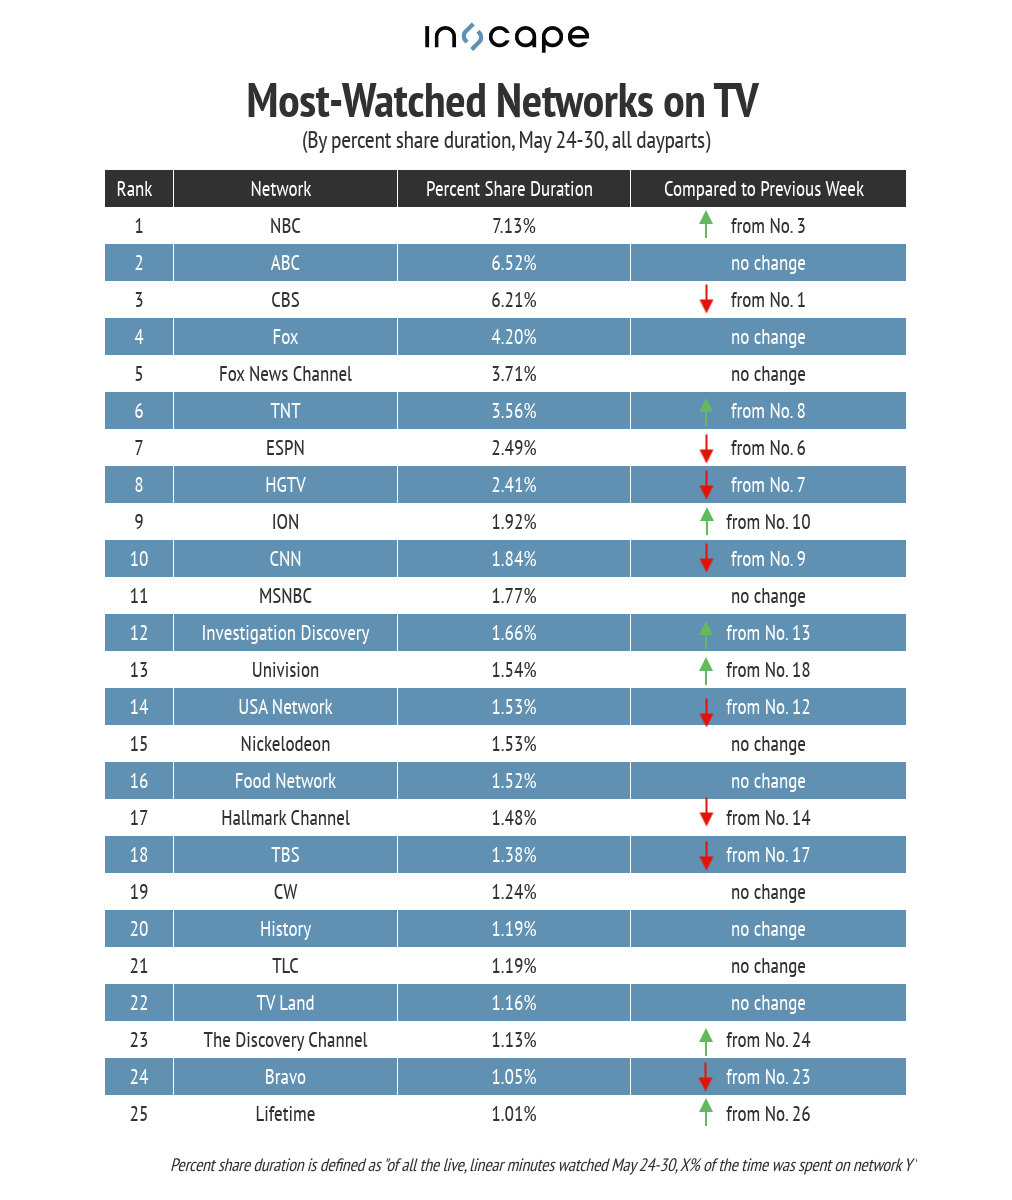
On the strength of the Indy 500 and The Voice’s two-part season finale, NBC jumped up to No. 1 in the network rankings (from third last week), with 7.13% of watch-time. ABC stayed in second with 6.52% of minutes watched, buoyed by the ongoing NBA Playoffs, while TNT (which also airs the playoffs) climbed from eighth to sixth. Lifetime moved up to 25th, with 1.01% of watch-time on the week, to close out the top 25.
Top Shows and Networks by TV Ad Impressions
Via iSpot.tv, the always-on TV ad measurement and attribution company. Rankings are by TV ad impressions, for new episodes only.
The smarter way to stay on top of broadcasting and cable industry. Sign up below
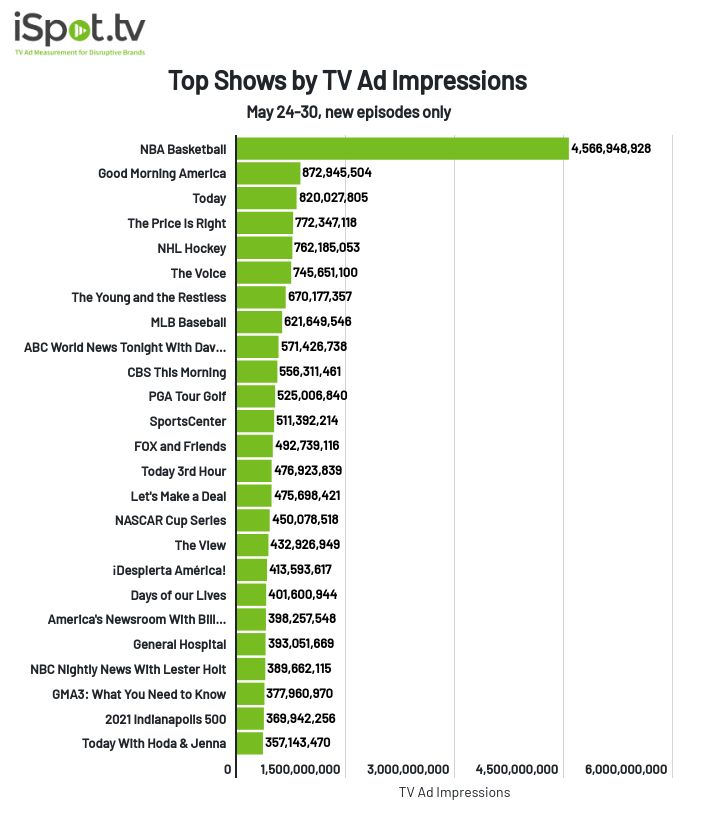
Now fully in the swing of the playoffs, NBA games reigned supreme again, delivering nearly 4.6 billion TV ad impressions from May 24-30 (a 49% jump from the previous week). Good Morning America moved up one spot to second, with 873 million TV ad impressions, followed by Today (820 million), The Price Is Right (772 million) and NHL hockey (762 million).
NASCAR programming saw major increases for the week, fueled by both the Indianapolis 500 and Coca-Cola 600. The latter paced a TV ad impressions increase of 153% week-over-week for the NASCAR Cup Series.
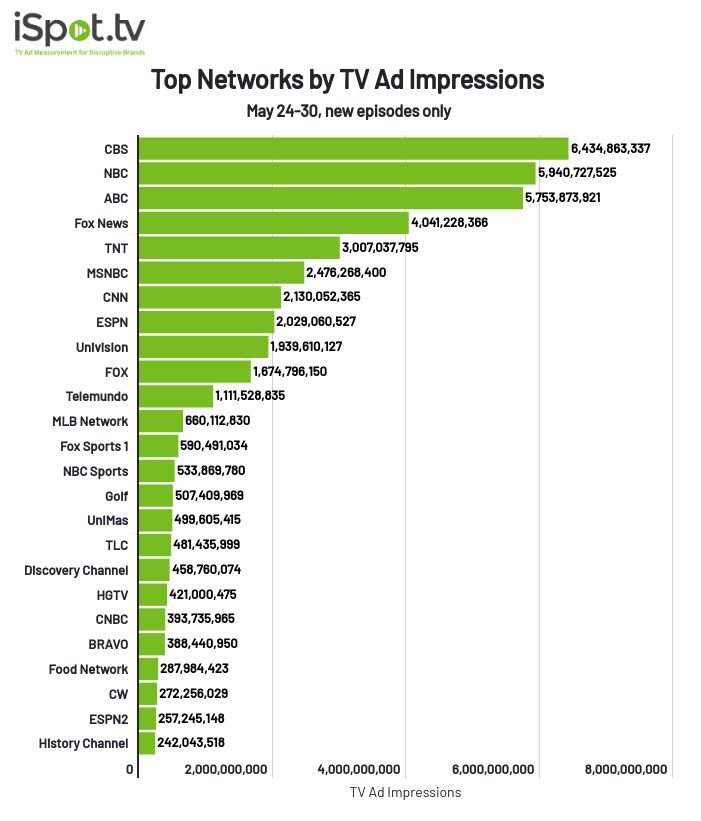
CBS remained atop the ad-impressions-by-network rankings, with over 6.4 billion TV ad impressions — nearly 500 million more than NBC (which moved up one spot from the previous week, to second). Despite the NBA playoffs — partly airing on the network — ABC moved down one spot to third.
Fox News and TNT (another NBA Playoffs TV partner) rounded out the top five on the week. TNT’s impressions more than doubled week-over-week with the NBA’s first-round series all heating up. ESPN2 maintained a spot within the top 25 on the strength of NCAA postseason action for softball and baseball. And History Channel closed out the ranking in 25th place, up one spot from the week before.
John Cassillo is an analyst and contributor with TV[R]EV.
