TV By the Numbers: NBA Playoffs Pay Off With Ad Impressions, Watch Time
With insights from Vizio’s Inscape and iSpot.tv
The smarter way to stay on top of broadcasting and cable industry. Sign up below
You are now subscribed
Your newsletter sign-up was successful
Here’s our quick snapshot of TV by the numbers for the week of May 31-June 6, showcasing the most-watched shows and networks using glass-level data from Vizio’s Inscape, and the top shows and networks by TV ad impressions with insights via iSpot.tv.
Most-Watched Shows and Networks
Via Inscape, Vizio’s TV data product with glass-level insights from a panel of more than 17 million active and opted-in smart TVs. Data is linear, live TV only and includes all episode types (new and reruns). Rankings are by percent share duration (i.e., time spent watching).
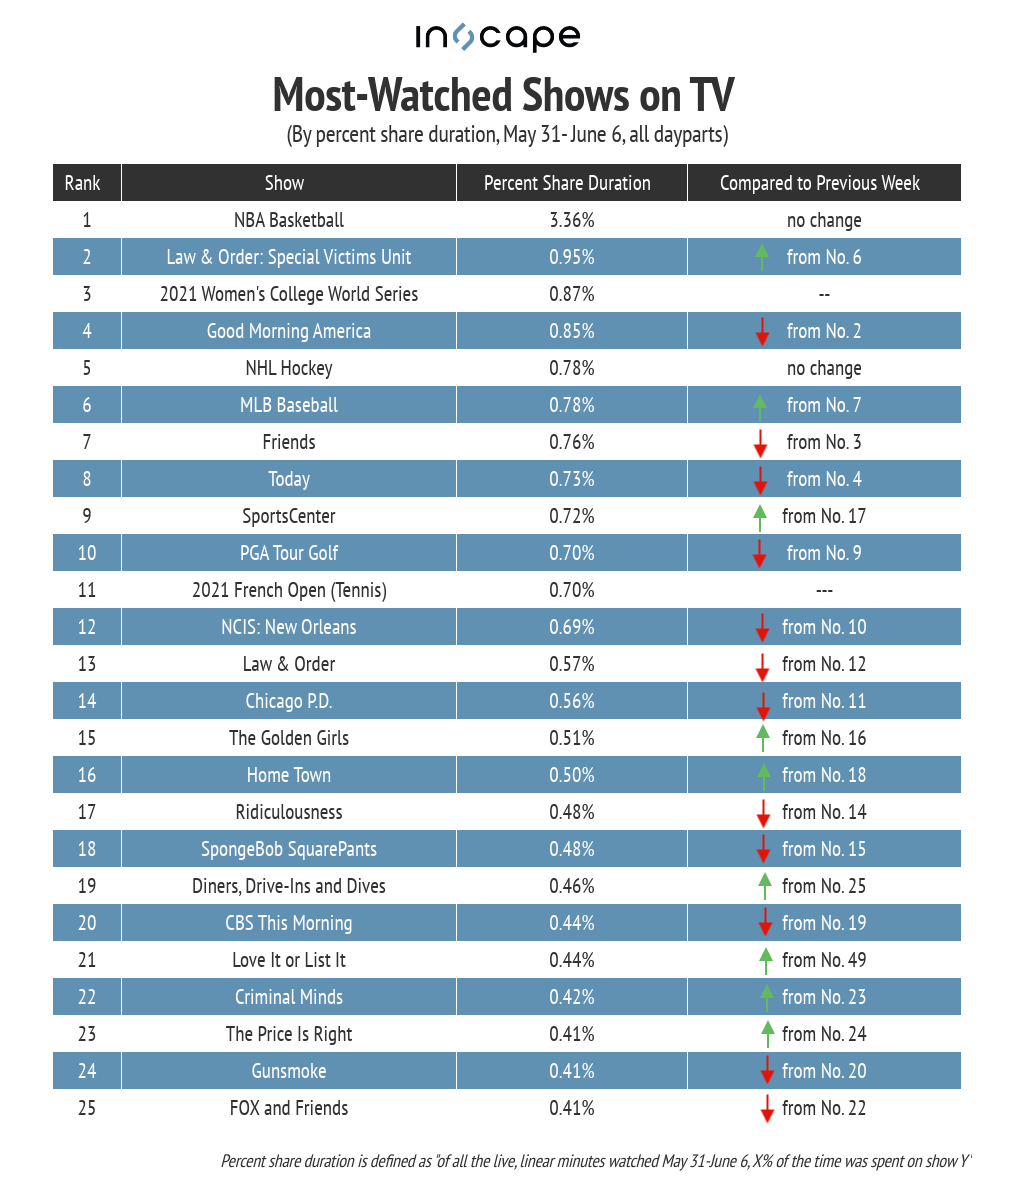
Once again, the NBA Playoffs reigned supreme on TVs, with games remaining in first place for watch-time with a 3.36% share of minutes watched (down from 4.33% last week as the postseason field narrowed). Sports programming generally dominated, grabbing six of the top 11 spots for the week of May 31-June 6.
Law & Order: Special Victims Unit jumped to No. 2 (0.95% of watch-time) on the strength of its season finale airing on CBS. It was followed by the 2021 Women’s College World Series (0.87% of minutes watched), Good Morning America (0.82%) and NHL hockey (0.78%).
The Women’s College World Series and the 2021 French Open were the biggest movers just by way of not being on TV the prior week. But week-over-week, SportsCenter jumped from 17th to ninth; Diners, Drive-Ins & Dives moved from 25th to 19th; and Love It or List It leapt all the way from 49th to 21st.
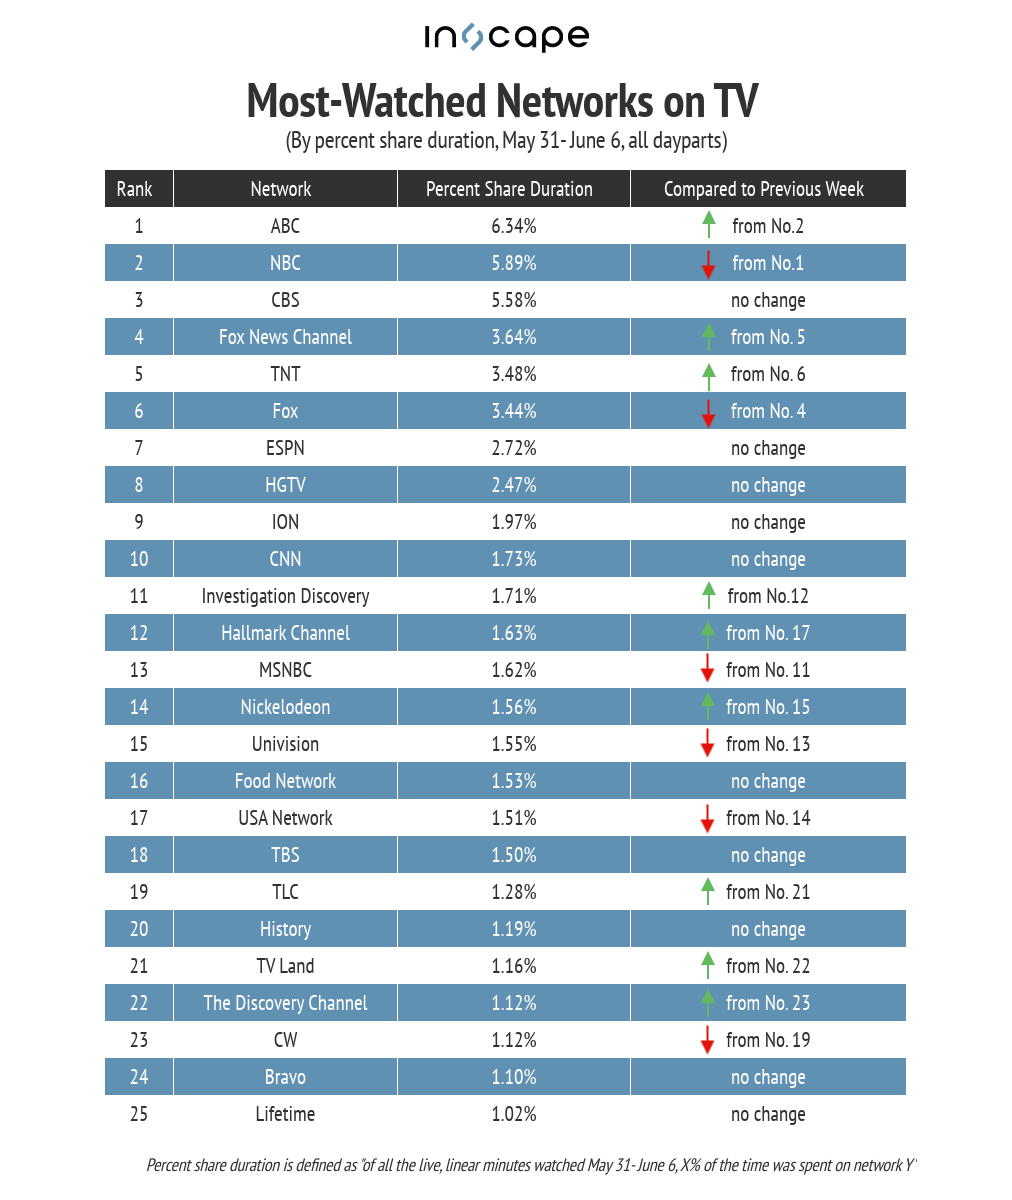
ABC nabbed the No. 1 spot in the network rankings (from second last week), with 6.34% of watch-time. Along with Good Morning America and the NBA Playoffs, the network also benefited from the season finale of Grey’s Anatomy airing last week.
NBC shifted down one place to second with 5.89% of minutes watched, followed by CBS, which stayed in third with 5.58%. Hallmark Channel moved up from No. 17 to No. 12 on the week, and TLC nudged up slightly into the top 20 (from 21st to 19th). The top 25 once again concluded with Lifetime, which had 1.02% of watch-time on the week.
The smarter way to stay on top of broadcasting and cable industry. Sign up below
Top Shows and Networks by TV Ad Impressions
Via iSpot.tv, the always-on TV ad measurement and attribution company. Rankings are by TV ad impressions, for new episodes only.
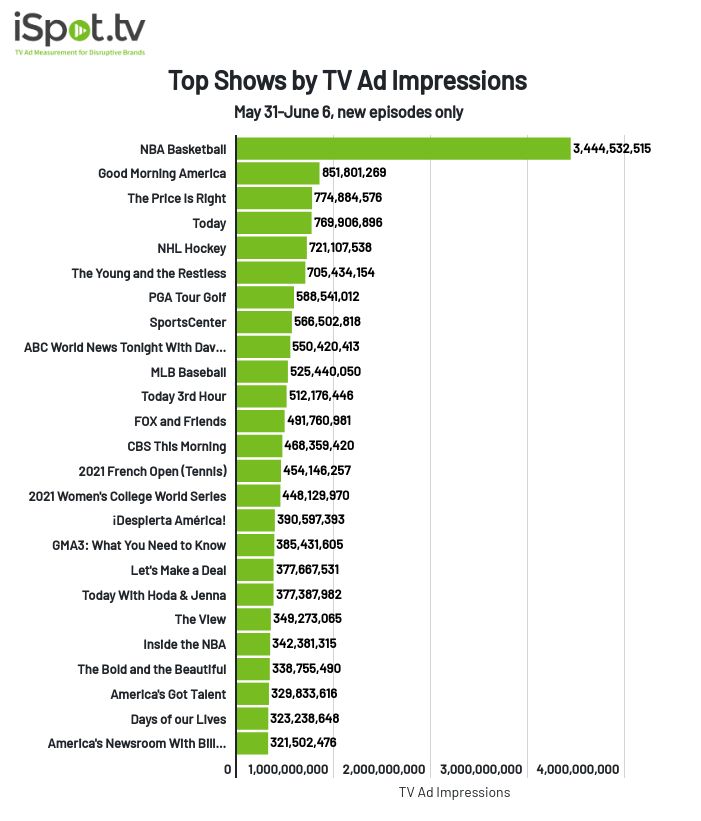
The NBA Playoffs continued, and so did the league’s place at the top of these rankings. From May 31-June 6, the NBA Playoffs delivered over 3.4 billion TV ad impressions. Good Morning America stayed in second, with 852 million TV ad impressions, followed by The Price Is Right (775 million), Today (770 million) and the NHL (721 million).
Both the 2021 French Open and 2021 Women’s College World Series were new arrivals in the top 25, given the fact that, as noted earlier, neither occurred the week prior. Same goes for America’s Got Talent, which entered the ranking following its June 1 season premiere on NBC.
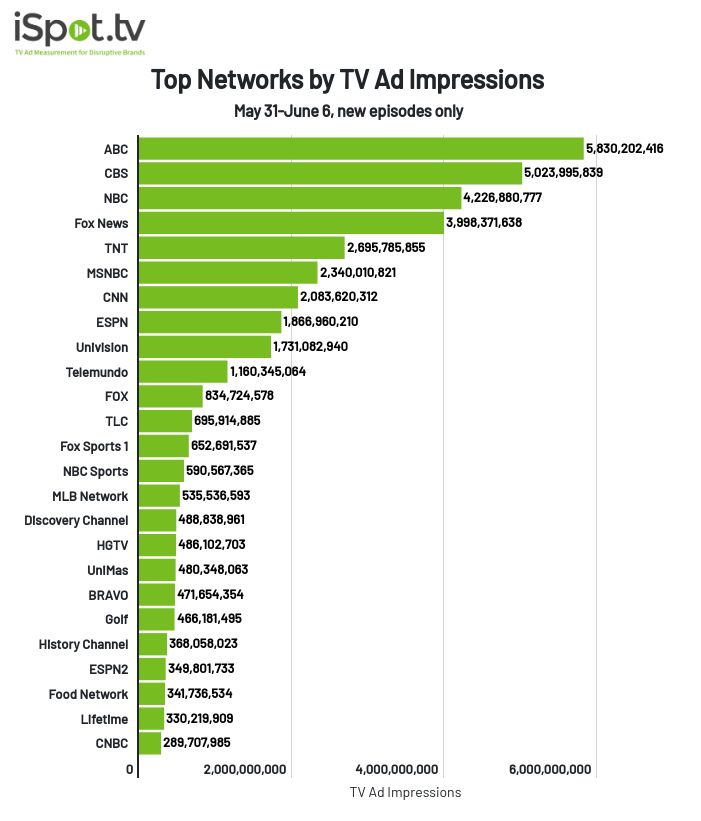
ABC moved to the top of the ad-impressions-by-network rankings on the week, thanks to the aforementioned boosts from GMA, the NBA and the Grey’s Anatomy finale. The network served up over 5.8 billion TV ad impressions from May 31-June 6. That’s 16% more than CBS (the previous No. 1) had for the timeframe.
NBC, Fox News and TNT rounded out the top five on the week, while Telemundo was the lone new entrant in the top 10. TLC also continued its climb, moving from 17th to 12th. Some shuffling around at the bottom of the chart meant CNBC closed things out at 25 (it was 20th the week before).
John Cassillo is an analyst and contributor with TV[R]EV.
