TV By the Numbers: Sept. 28 - Oct. 5
Sports still lead overall, while CNN & MSNBC saw more weekend watch-time
The smarter way to stay on top of broadcasting and cable industry. Sign up below
You are now subscribed
Your newsletter sign-up was successful
This is a quick snapshot of TV by the numbers for the week of Sept. 28 through Oct. 4, revealing the most-watched shows and networks using glass-level data from Vizio's Inscape, and the top shows and networks by TV ad impressions with insights via iSpot.tv. Today we also have a special section with social video trends for the first presidential debate via Tubular Labs.
Most-Watched Shows and Networks
Via Vizio's Inscape, the TV data company with insights from a panel of more than 16 million active and opted-in smart TVs. Data is linear, live TV only and includes all episode types (new and reruns). Rankings are by percent share duration (i.e., time spent watching). Note: The rankings below do not include the presidential debate — for more on that, check out our recap here.
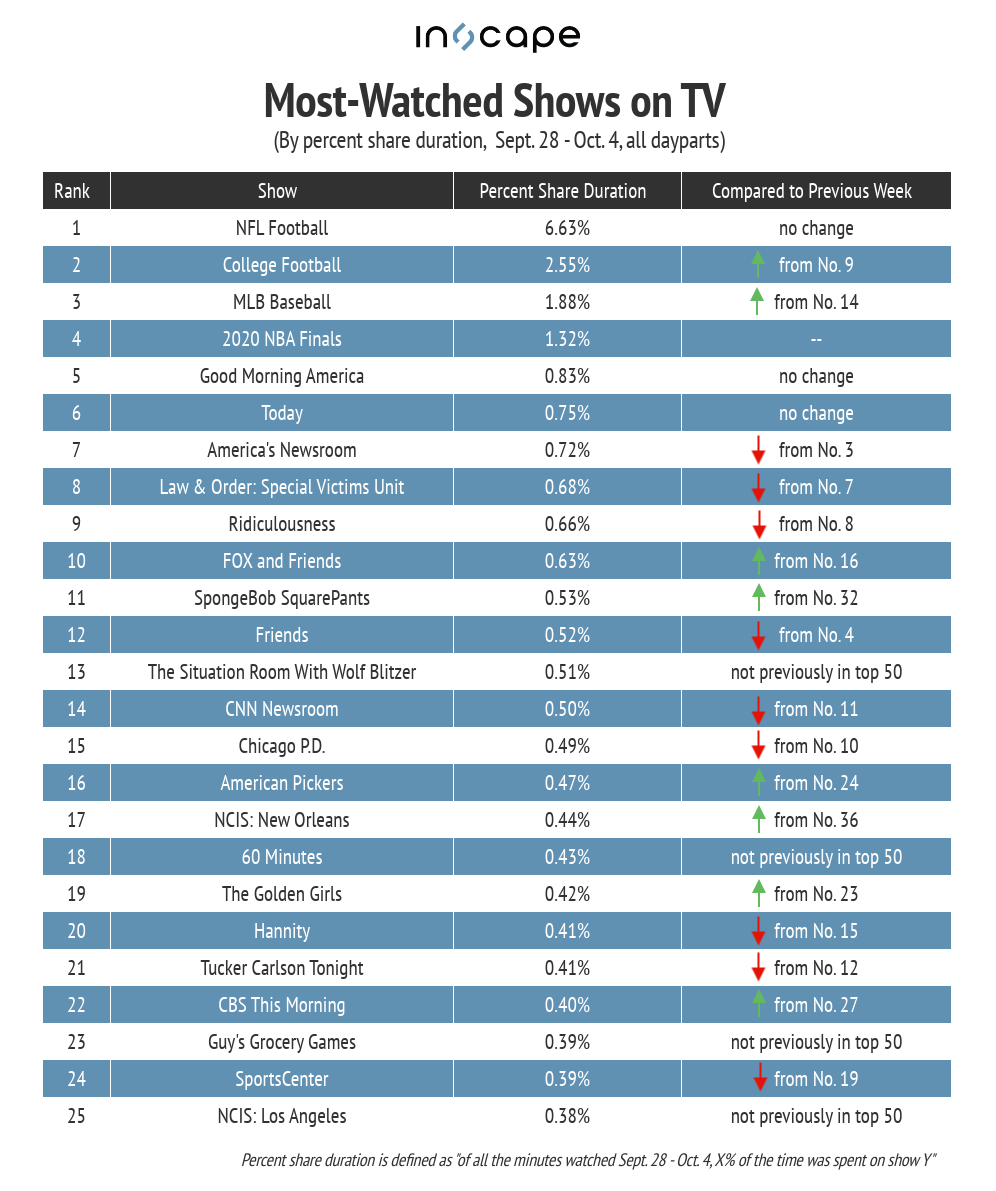
It was a big week for sports: Four out of the top five programs by watch-time were sports-related, led once again by the NFL (6.63% share duration). College football jumped into second place from ninth last time (2.55% share duration), followed by MLB games (1.88%) and the 2020 NBA Finals (1.32%). A few new shows made the ranking that didn’t crack the top 50 the previous week: The Situation Room With Wolf Blitzer, 60 Minutes, Guy’s Grocery Games and NCIS: Los Angeles.
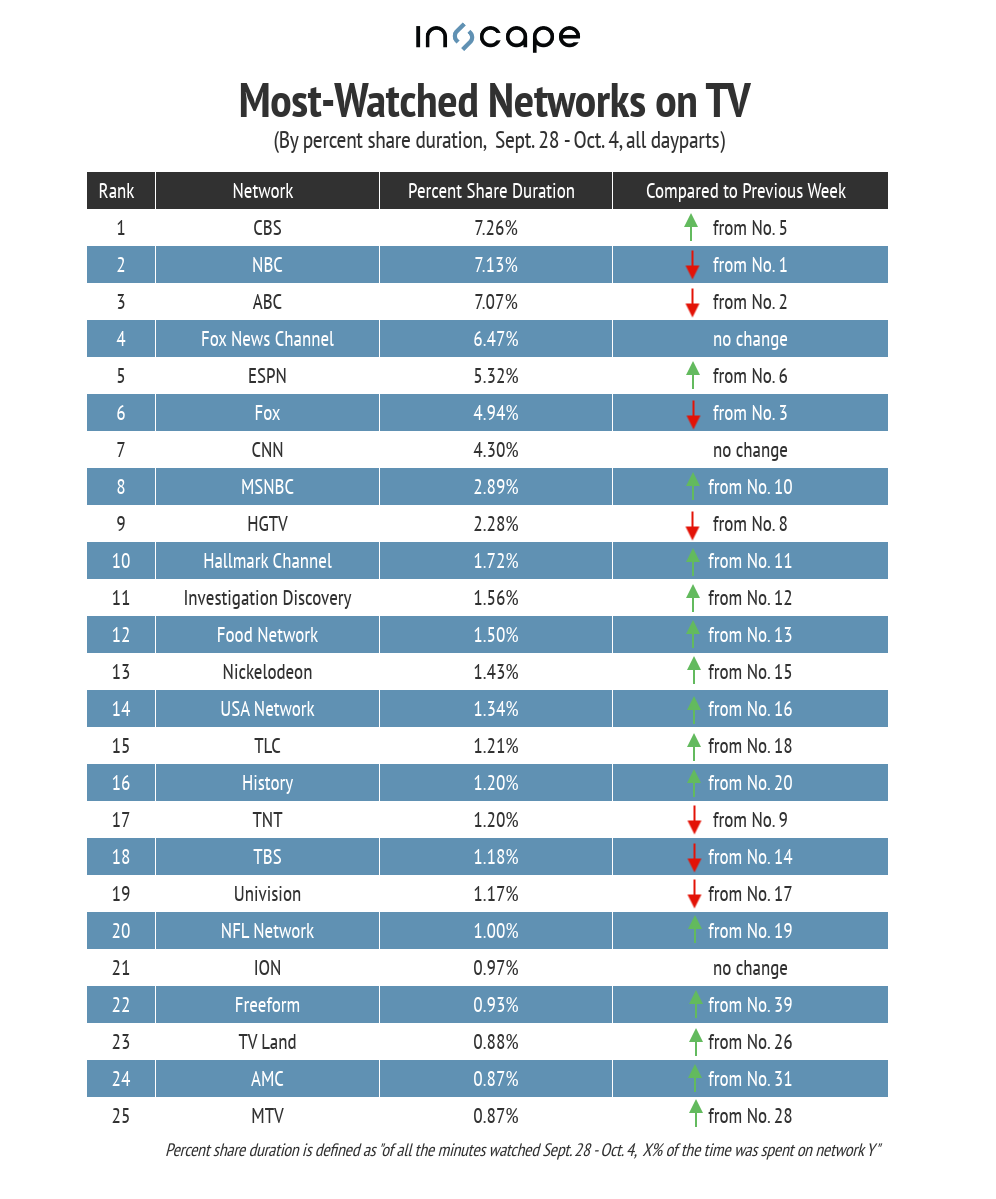
On the network side of things, CBS jumped into first place with a 7.26% share duration, up from fifth place last time. NBC (7.13%) and ABC (7.07%) slipped slightly although still made the top three. The middle-of-the-pack networks all moved up during the week measured, while TNT, TBS and Univision were three networks that dropped in the ranking.
It’s also worth mentioning how big a weekend it was for cable news given President Trump’s coronavirus diagnosis. Of all the live, linear minutes watched from Friday, Oct. 2 through Sunday, Oct. 4, 5.16% of the time was spent on Fox News — slightly less watch-time than the previous weekend (5.17% from Sept. 25-27). CNN, on the other hand, more than doubled its share of watch-time, up to 4.61% vs. 2.20%. Time spent with MSNBC was up as well, with a 2.17% share duration this past weekend compared to 1.80% the weekend of Sept. 25-27.
Top Shows and Networks by TV Ad Impressions
The smarter way to stay on top of broadcasting and cable industry. Sign up below
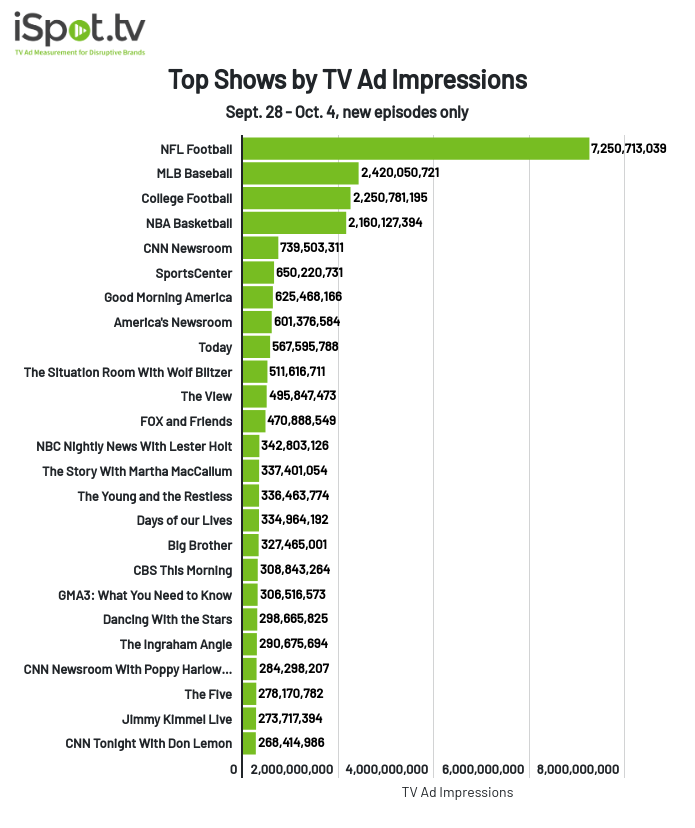
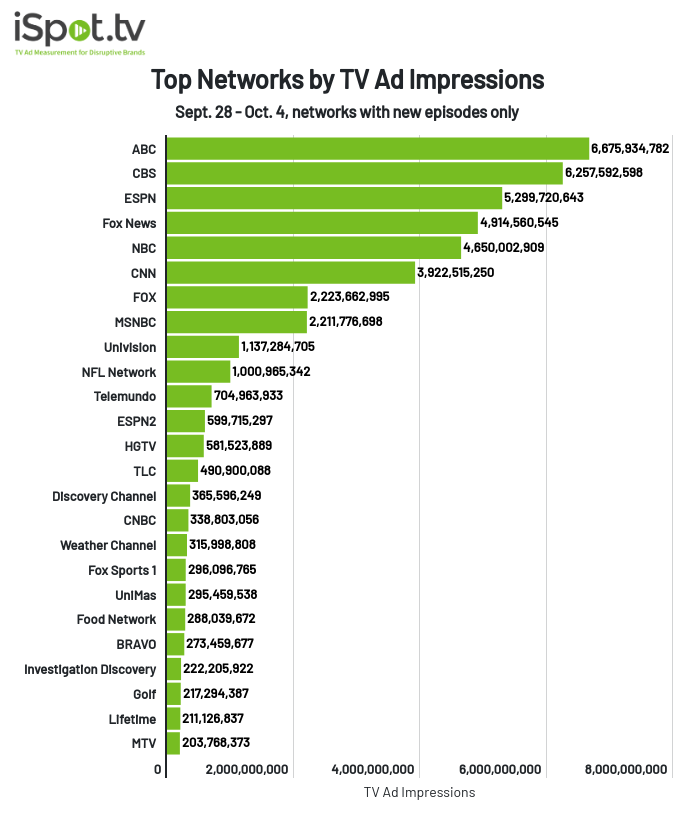
Via iSpot.tv, the always-on TV ad measurement and attribution company. Rankings are by TV ad impressions, for new episodes only and this does not include the first presidential debate.
Although the NFL remained in first place, impressions generated by games dropped to 7.25 billion in the last week vs. 8.1 billion previously. The MLB jumped up the ranking into second place, racking up 2.4 billion impressions, an impressive 525.1% increase from the previous week. College football and the NBA were close behind, while CNN Newsroom rounded out the top five with 739.5 million impressions. The Situation Room With Wolf Blitzer also experienced a notable increase in impressions, up 74.43% week-over-week.
ABC leads for networks for the second week in a row with 6.68 billion TV ad impressions, 31.8% of which came from NBA games. CBS rose into second place with 6.26 billion impressions, followed by ESPN (5.3 billion). Networks new to the top 25 ranking included Lifetime (211.1 million impressions) and MTV (203.8 million).
Social Video Insights for Presidential Debate
According to an analysis from Tubular Labs, news media dominated coverage of the first presidential debate on YouTube. The top creators for debate content, ranked by YouTube views in the seven days ending Oct. 2, were Fox News (13.5 million views), C-SPAN (12.4 million), ABC News (11.3 million) CNN (9.5 million) and CBS News (8 million). The most-viewed videos used hashtags such as #presidentialdebate (22.8 million views), #trump (15.3 million) and #biden (13.3 million).
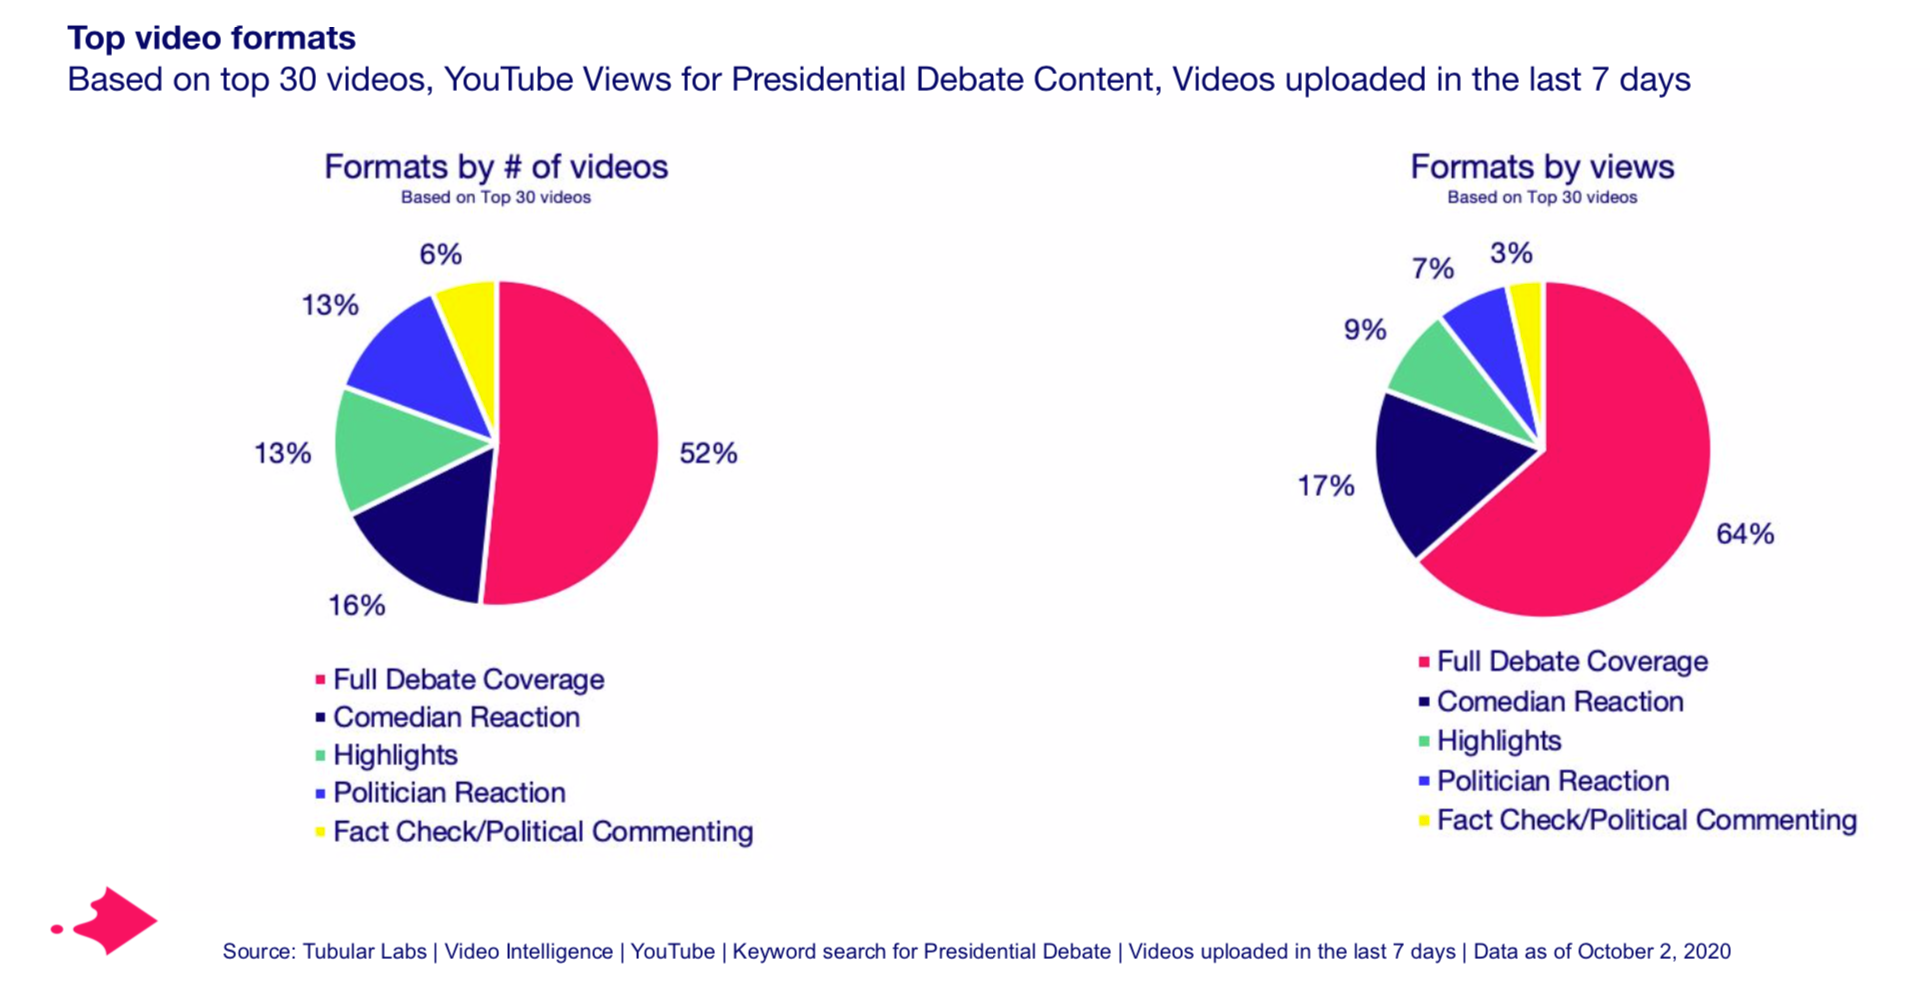
Coverage of the full debate was the most-watched format among the top videos on YouTube, but comedian reactions also ranked high:
