Viewership and Advertising Insights for the 10th Democratic Debate
The smarter way to stay on top of broadcasting and cable industry. Sign up below
You are now subscribed
Your newsletter sign-up was successful
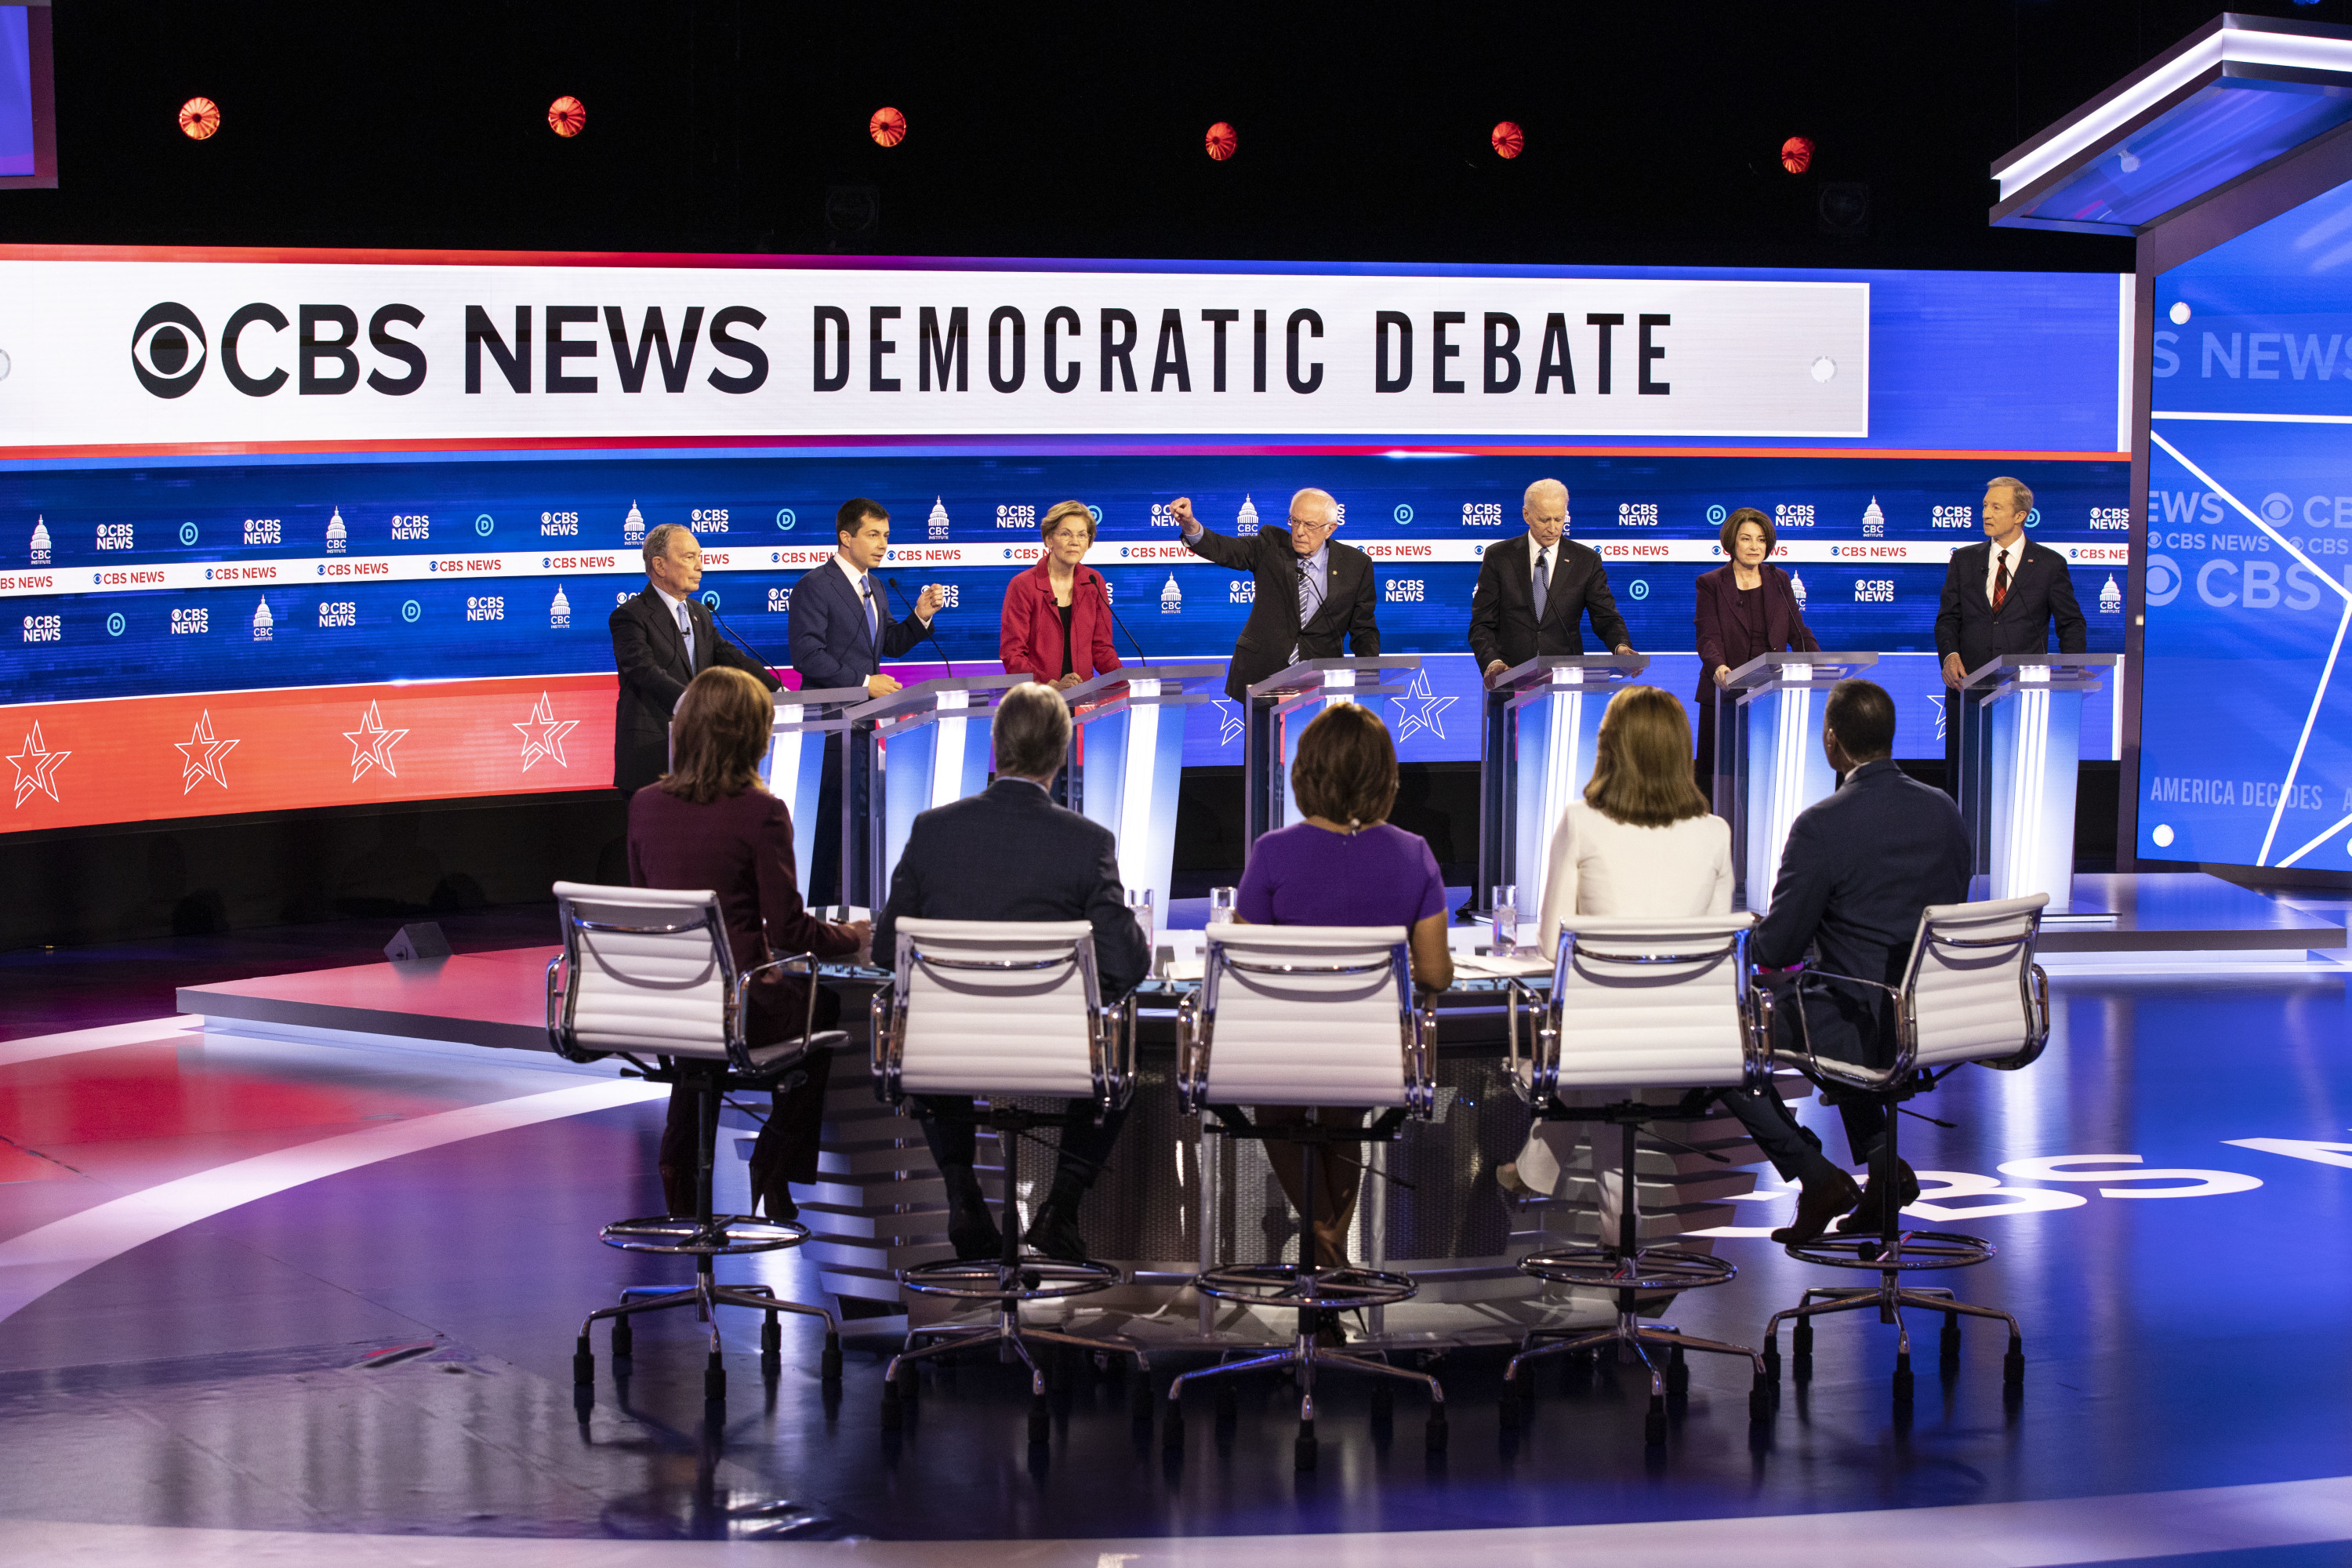
On Tuesday night, seven candidates took the stage for the last debate before the South Carolina primary and Super Tuesday (March 3): former Vice President Joe Biden, Mike Bloomberg, Pete Buttigieg, Sen. Amy Klobuchar, Sen. Bernie Sanders, Tom Steyer and Sen. Elizabeth Warren. The debate moderators were Norah O'Donnell (CBS Evening News anchor), Gayle King (co-host of CBS This Morning), Face the Nation host Margaret Brennan, Major Garrett (chief Washington correspondent) and 60 Minutes correspondent Bill Whitaker.
Below, we examine viewership, advertising and social video trends around the debate and candidates using insights from Inscape, iSpot and Tubular Labs.
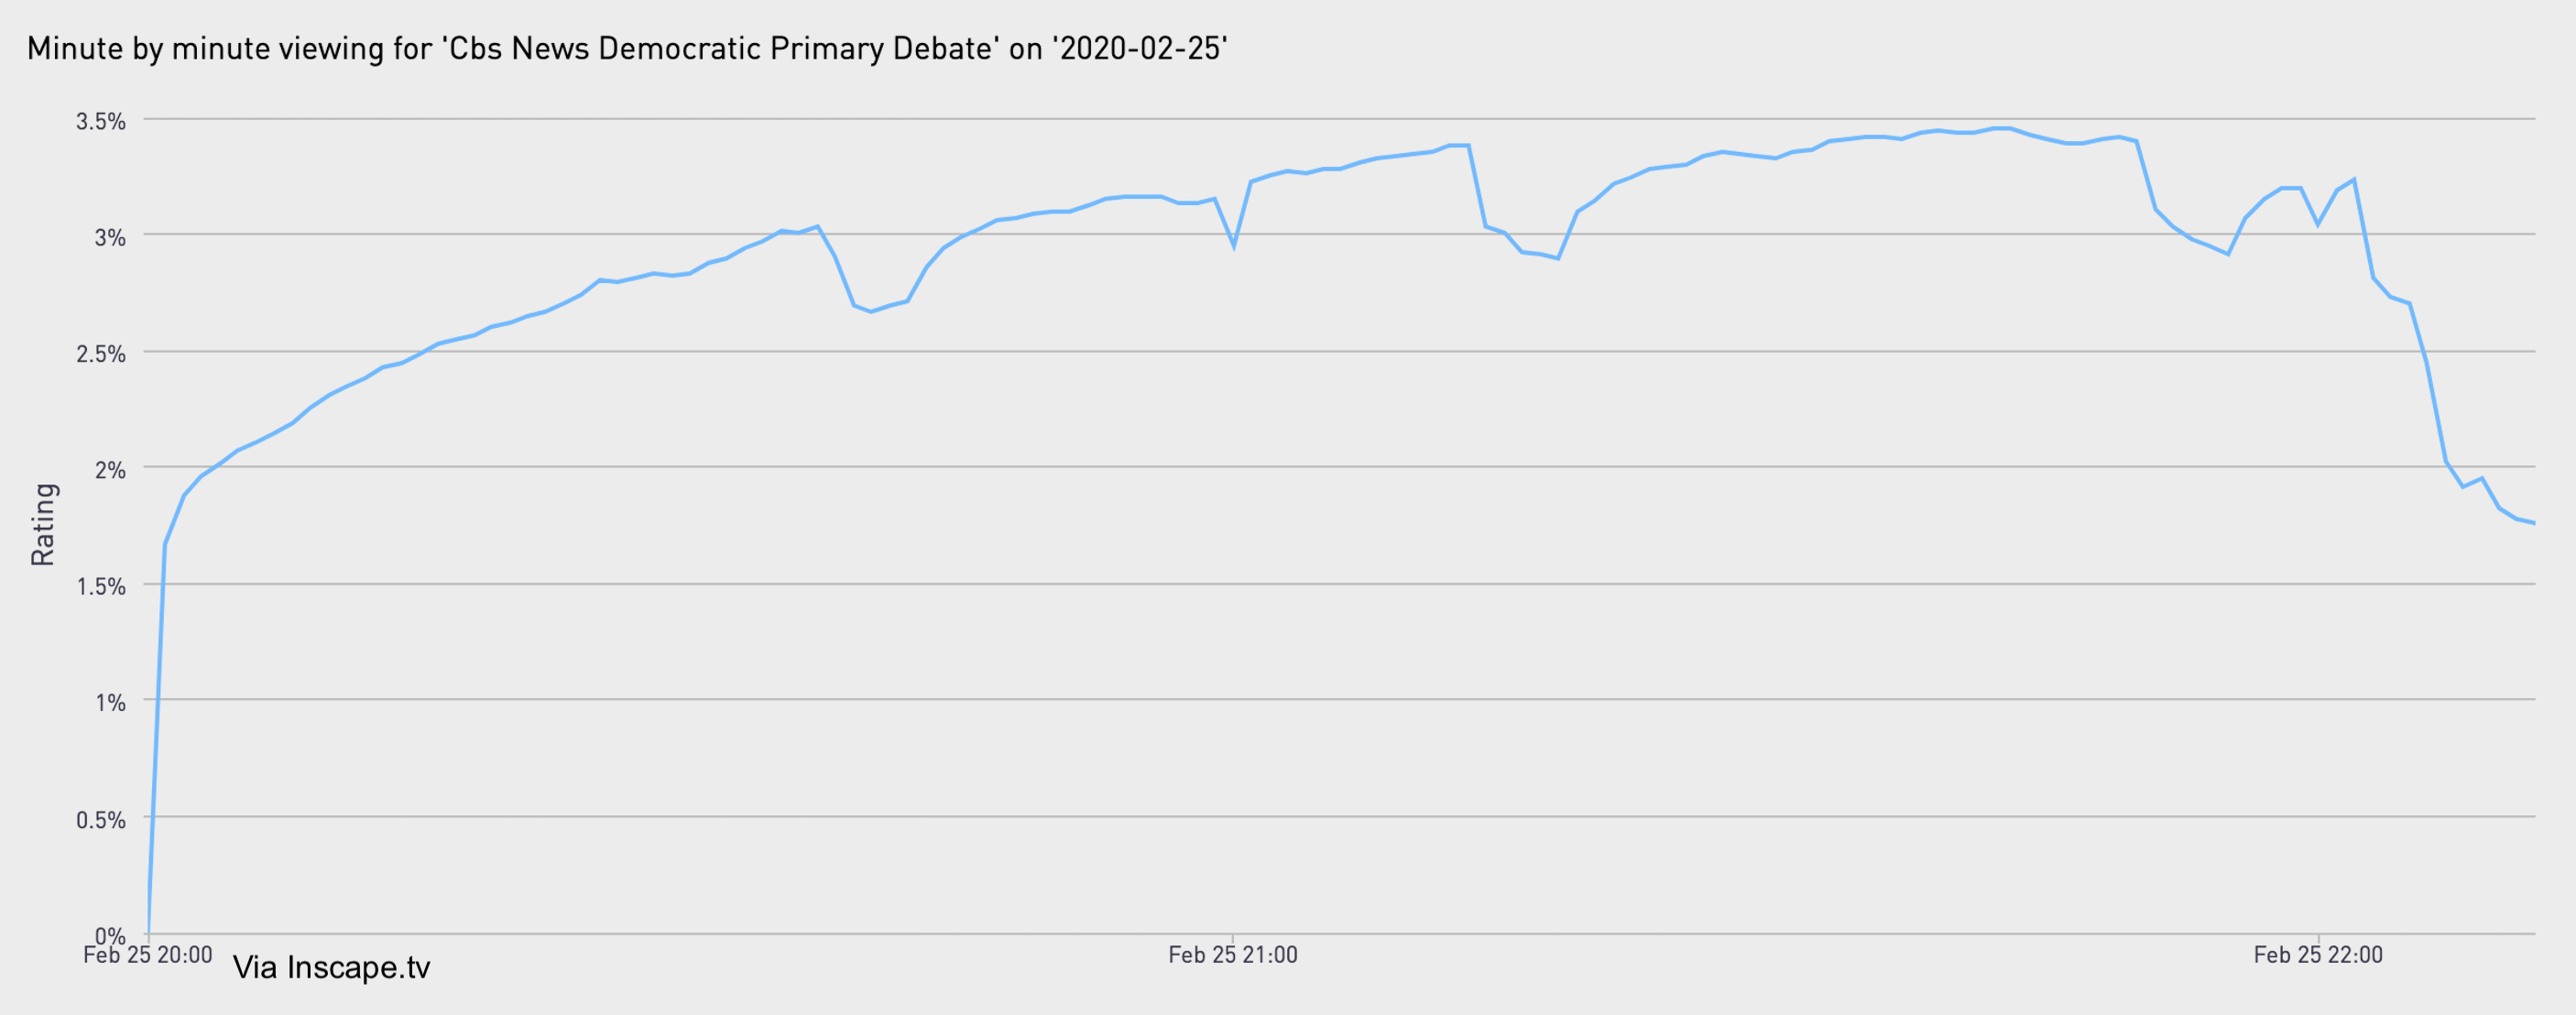
According to Inscape, the TV data company with glass-level insights from a panel of more than 12 million smart TVs, viewership peaked around 9:41-9:43 p.m. E.T., as candidates discussed foreign policy in regards to Israel and Palestine.
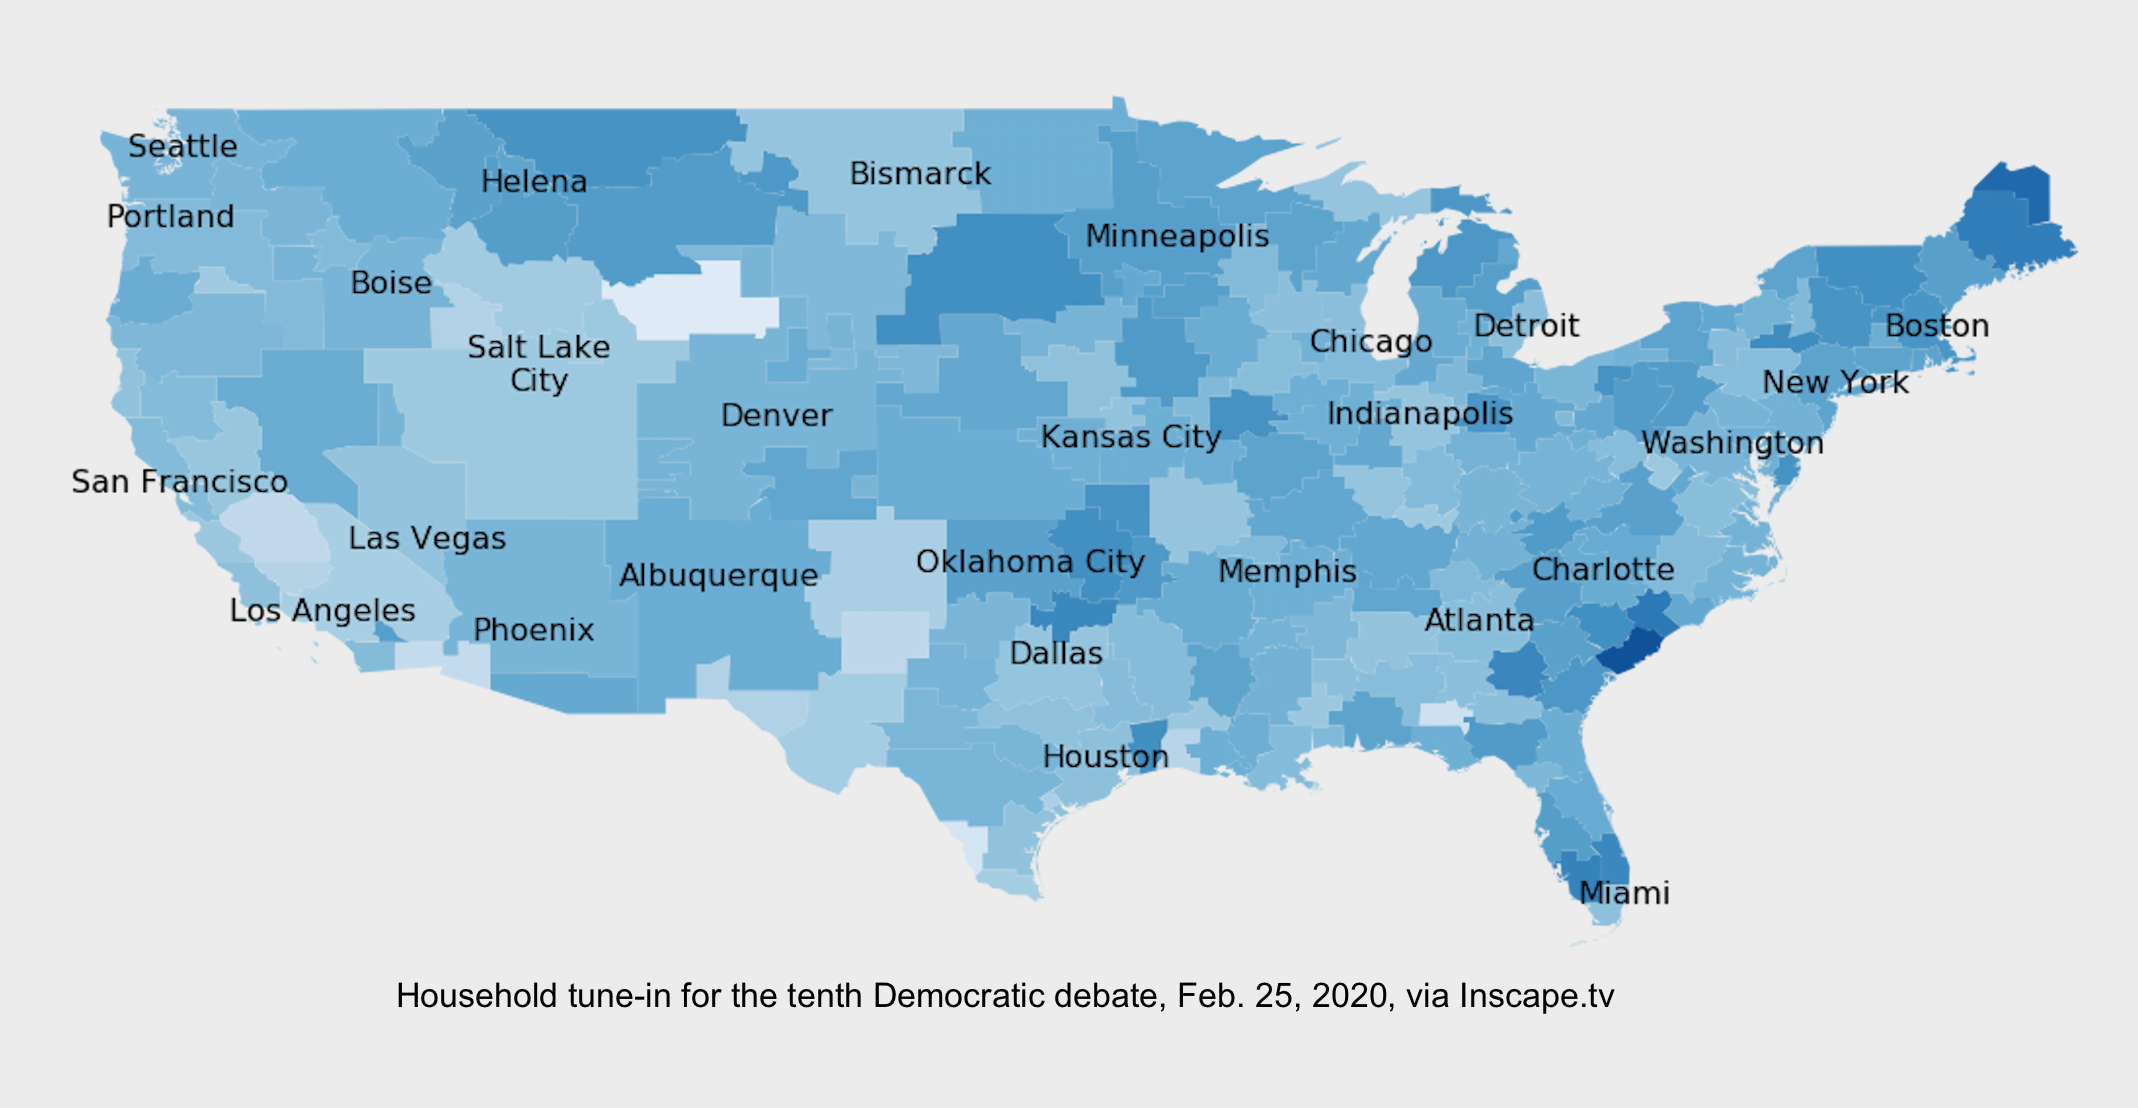
When it comes to where people were tuning in from, hotspots of household viewership included the Charleston, SC; Presque Isle, ME; Myrtle Beach-Florence, SC; West Palm Beach-Ft. Pierce, FL and Ft. Myers-Naples, FL DMAs.
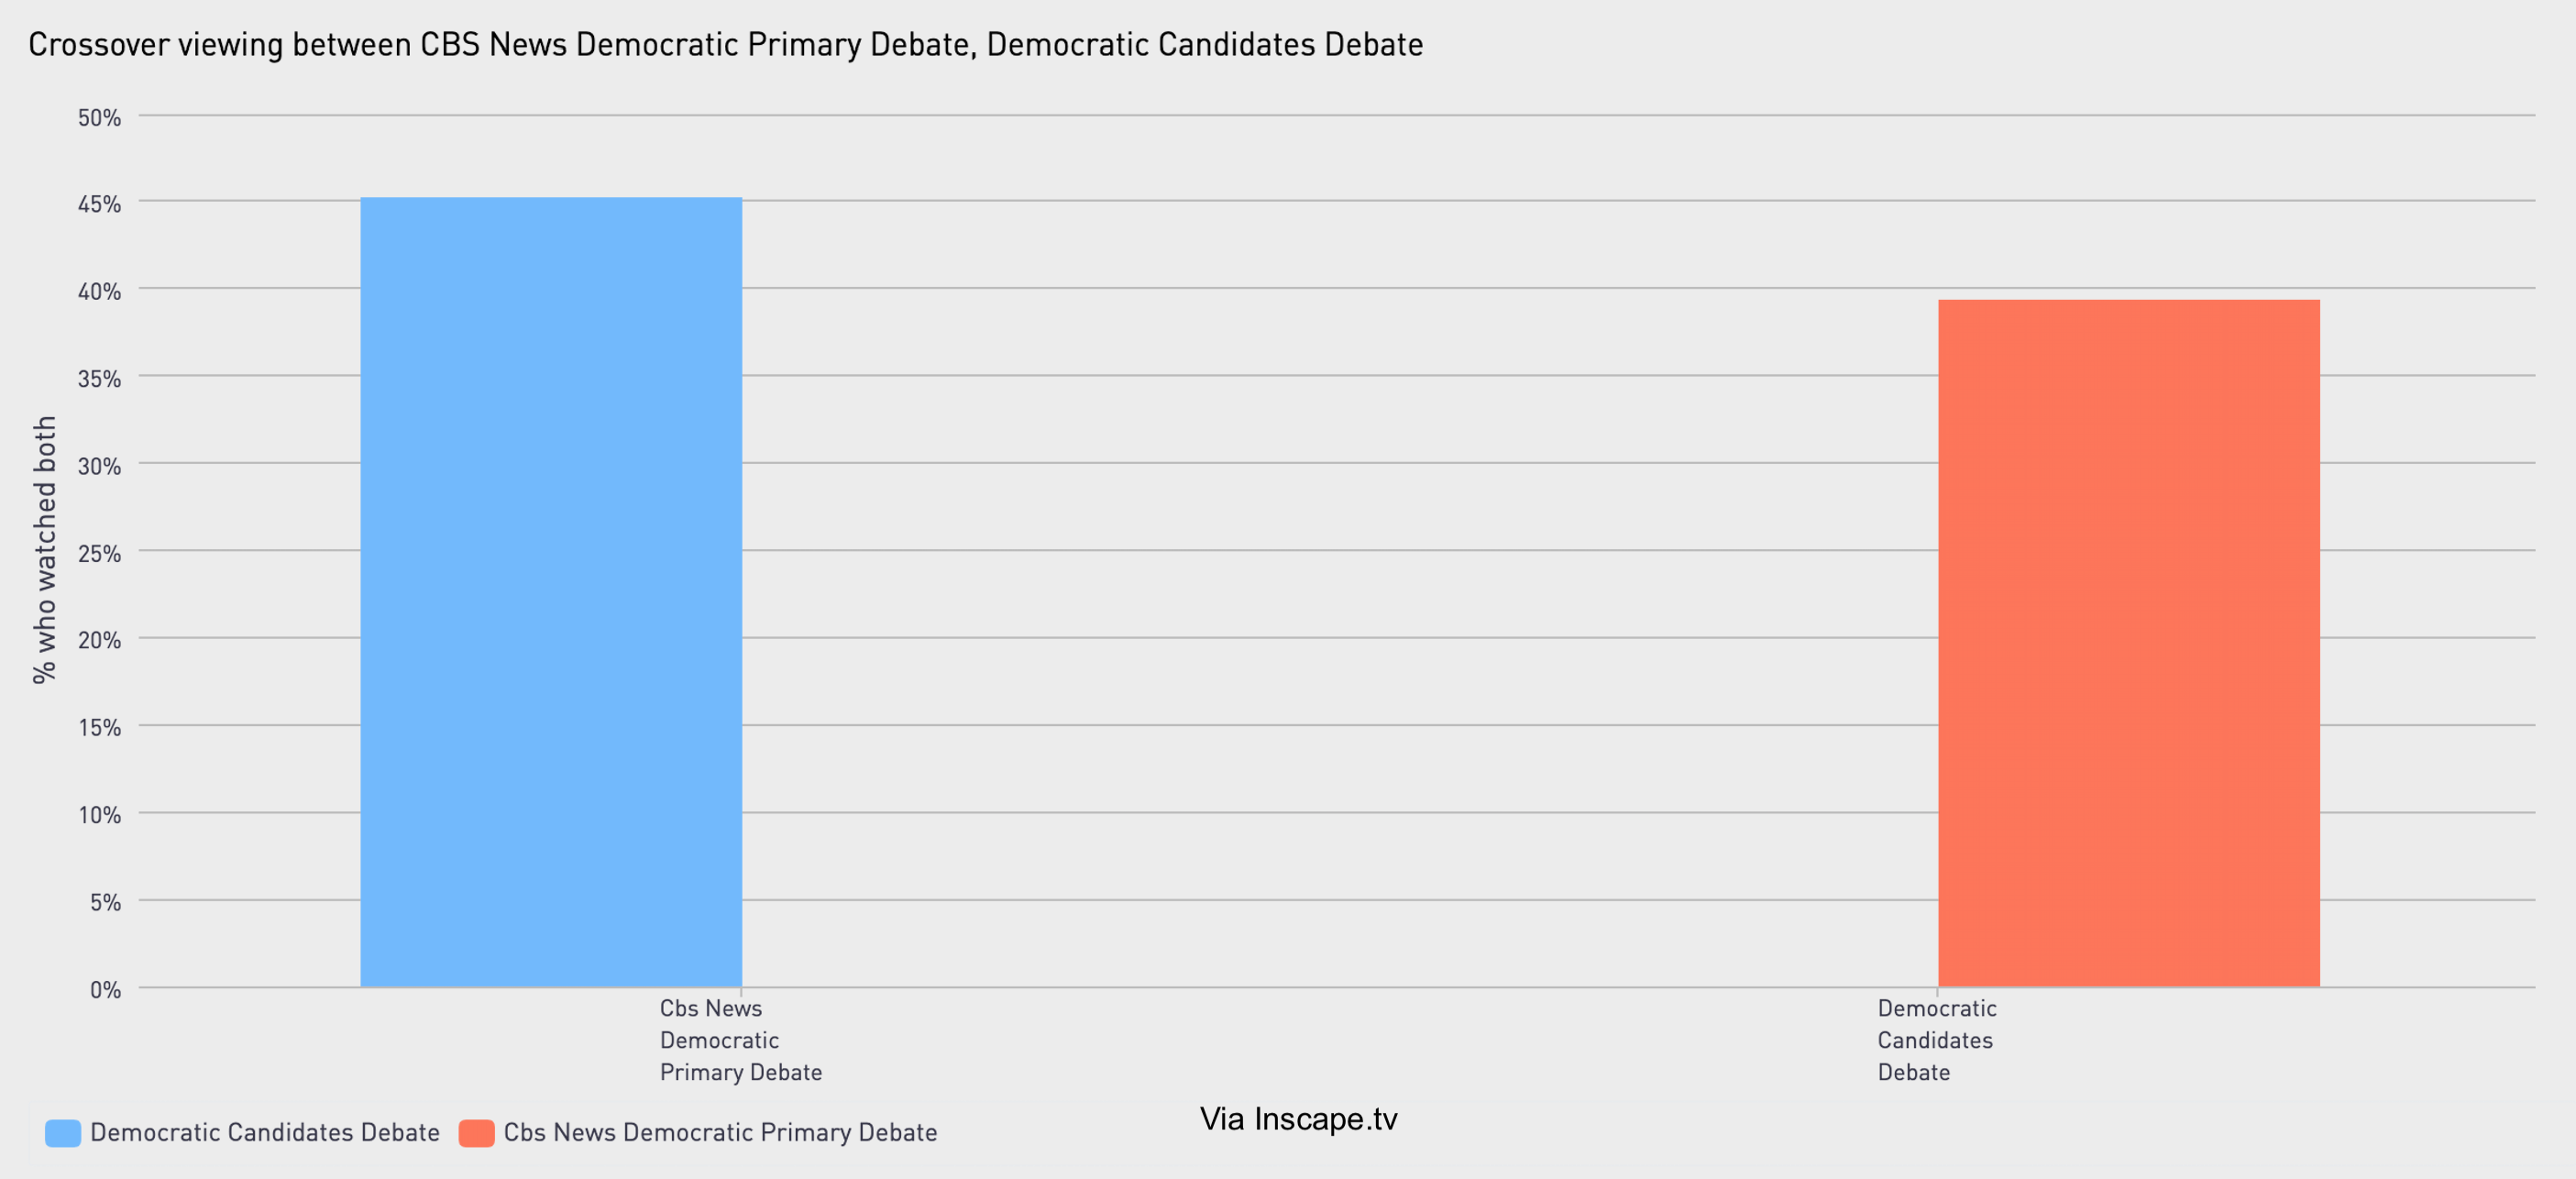
Inscape also provided a look at audience crossover for the ninth and 10th debates. (A note about methodology: You have to do more than just flip past a station with your remote to count as a “crossover viewer” in Inscape’s system. For the data below, the minimum viewing threshold is 10 minutes.) Of the 10th debate viewers, 45% had also tuned into the ninth debate, and 39% of the ninth debate watchers tuned in to the 10th debate.
Moving on to advertising insights, according to iSpot.tv, the always-on TV ad measurement and attribution company, there were over 309.8 million TV ad impressions over the course of the debate, which was simulcast on CBS and BET. The most-seen brands included ADT, Vanda Pharmaceuticals, Twentieth Century Fox and Dupixent (CBS makes the top five list because of the network promos that were aired).
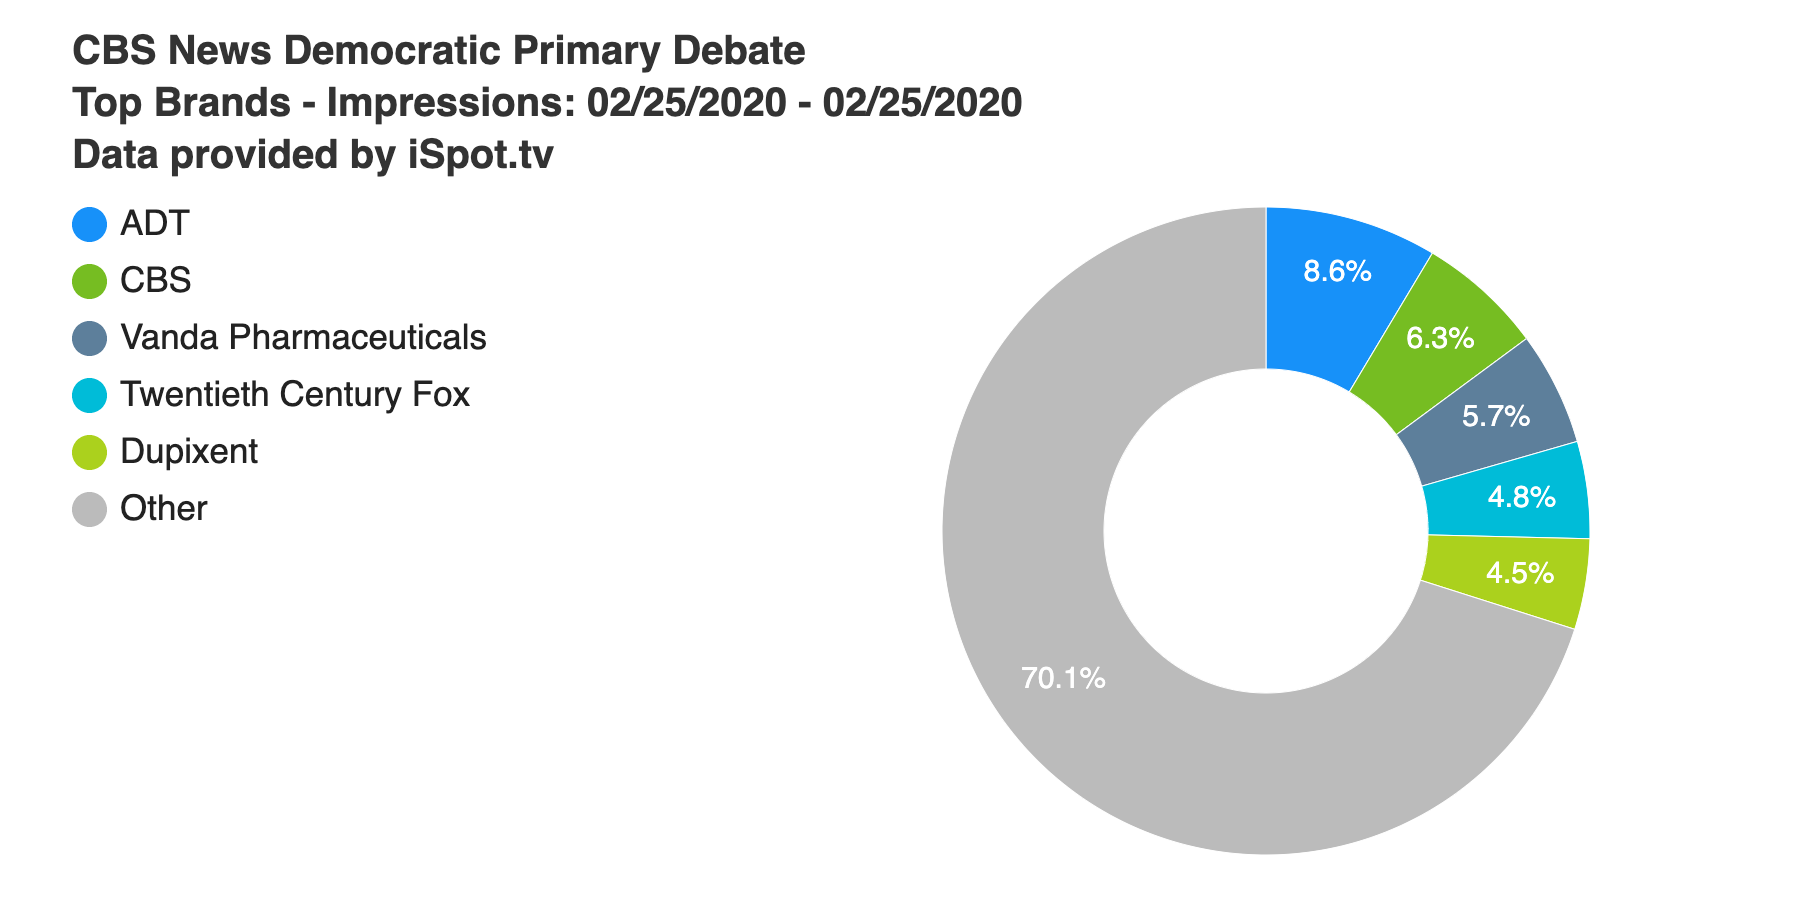
There were 77 ad airings, and ADT was the brand with the most airings, seven, of one spot featuring Property Brothers Jonathan and Drew Scott of HGTV fame. This spot also received above-average attention, with an iSpot Attention Index* of 140, meaning it received 40% fewer interruptions than average. Looking at total air time, Dupixent’s “Roll Up Your Sleeves” and Walmart’s “United Towns” both had three minutes on TV screens.
The smarter way to stay on top of broadcasting and cable industry. Sign up below
Social Video Trends
Bernie Sanders has won the popular vote in all three Democratic primary states so far — Iowa, New Hampshire and Nevada— and that momentum seems to be evident on social video platforms like Facebook, Instagram, Twitter and YouTube as well.
Since Jan. 1, videos about the Vermont senator have earned 707 million cross-platform views, which is the most among all Democratic contenders in that timeframe, according to video measurement company Tubular Labs. Former Vice President Joe Biden was second with 327 million, followed by Massachusetts Sen. Elizabeth Warren (227 million), former New York City Mayor Mike Bloomberg (226 million), and former South Bend, Indiana Mayor Pete Buttigeg (176 million). Videos about Minnesota Sen. Amy Klobuchar had just 54 million views.
The lead has become even more apparent for Sanders since the week of the Iowa Caucus (starting Feb. 2), with him collecting nearly 41% of all social video views about the candidates. Looking at the same timeframe, Bloomberg has 18%, Biden has 15% and Buttigieg has 13%. Warren has just 10% of views, while Klobuchar has 4%.
Of all videos having to do with the candidates above, the most views came via a Bernie Sanders Facebook video: “Trump Promised to End Endless Wars,” which has collected 8.2 million views since being posted on Jan. 4.
*The iSpot Attention Index represents the attention of a specific creative or program placement vs the average in its respective industry. The average is represented by a score of 100, and the total index range is from 0 through 200. For example, an attention index of 125 means that there are 25% fewer interrupted ad plays compared to the average. Interruptions include changing the channel, pulling up the guide, fast-forwarding or turning off the TV.
