Viewership Deep Dive: How Some of TV’s Top Reality Series Compare

The smarter way to stay on top of broadcasting and cable industry. Sign up below
You are now subscribed
Your newsletter sign-up was successful
As part of our continuing series of deep-dives into viewership and advertising trends surrounding different TV genres, today we’re taking a look at four broadcast-network reality series: NBC’s The Voice, ABC’s Dancing With the Stars, CBS’s Survivor: David vs. Goliath and Fox’s Hell’s Kitchen. Below, advertising insights courtesy of iSpot.tv, fans’ emotional drivers from Canvs, viewership crossover stats from Inscape and a look at the shows’ social video footprints from Tubular Labs. (Note: the data is through Dec. 1 and covers new episodes only.)
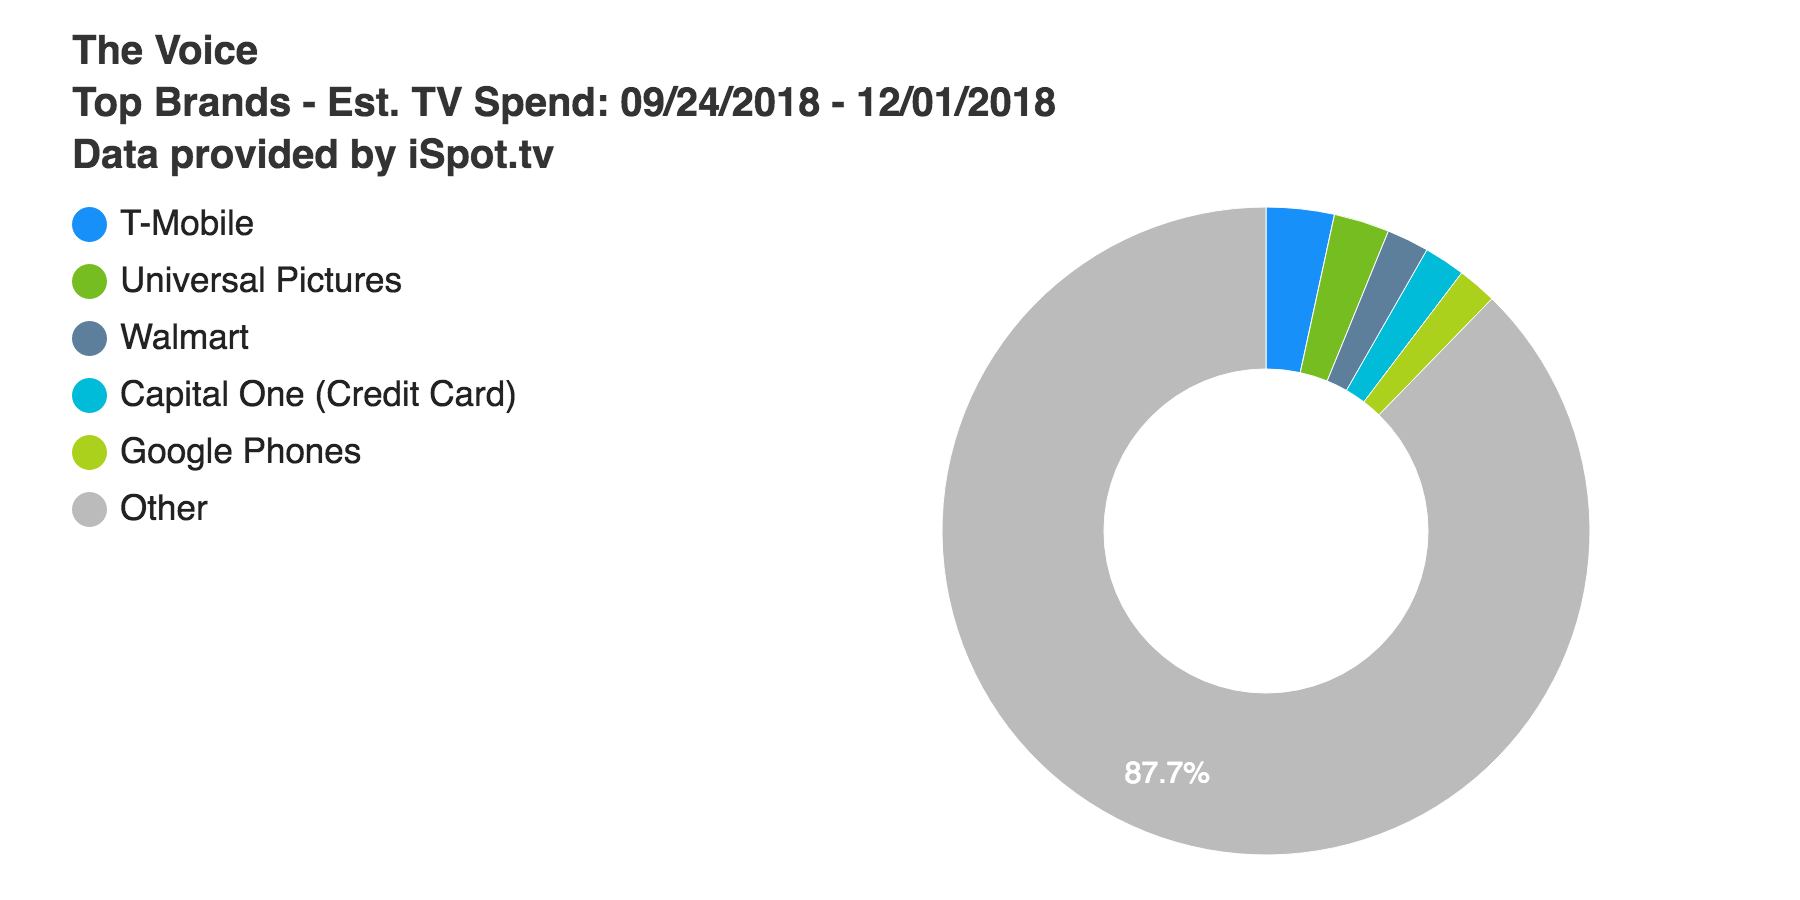
According to advertising analytics firm iSpot, The Voice blows the other shows out of the water when it comes to ad revenue, racking up a total estimated marketer spend of $124.4 million during the period measured, more than twice that of any of the other shows. T-Mobile has spent the most, followed by Universal Pictures, Walmart and Capital One.

Looking at top-spending industries, department stores have made big investments across the board, appearing in the industry top-five chart for each show. Movie studios have also spent big, showing up in the top five for three series.
We also partnered with emotion measurement AI company Canvs to discover what drove viewers’ emotional reactions to each of these reality shows. Although you may think the hosts and judges (often celebrities themselves) would drive the most emotion, it’s actually the contestants who brought out more feelings from fans. For The Voice, Lynnea Moorer and DeAndre Nico sparked high levels of Emotional Reactions (ERs), while on Dancing With the Stars it was duo Sharna Burgess and Bobby Bones (spoiler alert: they ended up winning) who had viewers talking. For Survivor, it’s Christian Hubicki and Angelina Keeley generating the feels. Hell’s Kitchen’s star/judge Gordon Ramsay is the exception, serving as the main emotional driver for his show, followed by Jen Gavin, who was the first chef to be booted out this season.
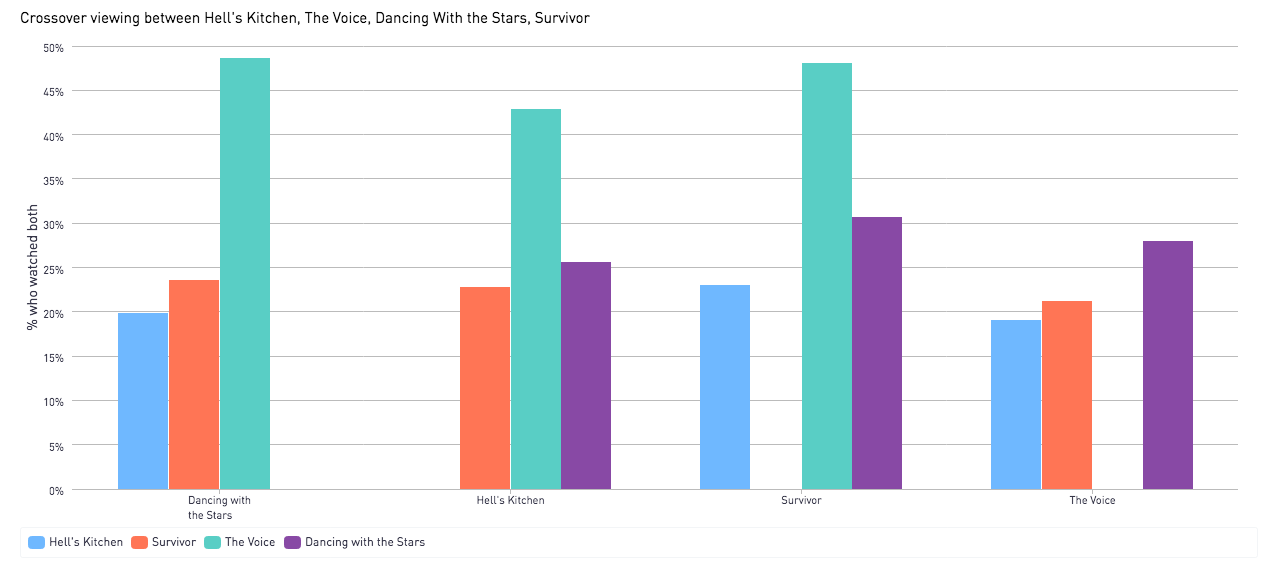
Crossover viewership data from Inscape, the TV data company with glass-level insights from a panel of more than 9 million smart TVs and devices, shows varied crossover among these series. Also, a note about methodology: You have to do more than just flip past a station with your remote to count as a “crossover viewer” in Inscape’s system. For the data below, the minimum viewing threshold is two minutes. Some specific insights:
- Perhaps somewhat predictably, the highest crossover (49%) is between Dancing With the Stars and The Voice.
- 48% of the people watching Survivor also check out The Voice.
- The lowest crossover (19%) is between The Voice and Hell’s Kitchen.

Inscape also revealed audience location trends about these series: Boston is a hot spot for people watching Hell’s Kitchen, while there’s a notable critical mass of viewership for Survivor in northern Maine. The Voice’s audience is fairly well distributed across the country, with concentrations in Southern Florida, Southern Louisiana and Northern Michigan DMAs. (On the heatmaps below, the darker the color in the graphic, the more households were tuning in.)

An analysis from social video analytics company Tubular reveals a difference in online video strategies among these series.
The smarter way to stay on top of broadcasting and cable industry. Sign up below
The Voice has uploaded more clips to Twitter than Facebook or YouTube (365, versus 325 and 250, respectively), but its most-watched video was on Facebook, with 8.1 million views so far, 2.1 million of which occurred in the first seven days, according to Tubular’s V7 metric. That same clip was also posted to YouTube and it’s racked up 7.4 million views, with a V7 rating of 3.2 million.
On the flip side of things, Dancing With the Stars has favored posting to YouTube over Facebook (246 clips vs. 158), and although the second most-watched video with 2 million views is from the original series, many of the other top clips are actually from its spinoff, Dancing With the Stars: Juniors.
Survivor is less active in regard to social video, posting only 102 clips to YouTube, 42 to Twitter and 40 on Facebook during the period measured. Its most-watched video with over 740K Facebook views is “Survivor Shade: 3.” That same trend continues for Hell’s Kitchen, which has uploaded 90 clips to Twitter, 62 to Facebook and 37 on YouTube. Its most popular video was posted to Twitter and has 90.7K views so far.
