Assessing the National Representativeness of Inscape Smart TV data

The smarter way to stay on top of broadcasting and cable industry. Sign up below
You are now subscribed
Your newsletter sign-up was successful
Summary
With more than nine million smart TVs nationwide, the Inscape smart TV data set provides a massive volume of granular data that can be matched against other data sources and used for TV measurement, attribution, and reporting. However, to be effective for these applications, it’s important to have a relatively even distribution of these connected smart TVs across the nation’s demographic and geographic make-up.
This white paper utilizes data from Experian, the market leader in consumer marketing data, to compare the Inscape population against 200 of the most important Experian attributes. We also compared the geographical distribution of Inscape data with Nielsen’s published DMA distribution.
The results show that the Inscape TV population has good national coverage, although adjustments on a DMA basis should be implemented for measurement. Against the Experian dataset, the Inscape data aligns well in most metrics. The key under-indexed segments are seniors, lower income consumers, and those who do not own their own homes. Campaigns looking to target these groups should factor in these variables in any analysis
Demographic Distrubutions
For the demographic comparison, we matched the Inscape TV population against Experian’s device graph. The IP addresses of each VIZIO TV were matched against the IP addresses that Experian associates with each house, and the demographics of each household compared to Experian’s extensive dataset of 300 million US consumers.
Age
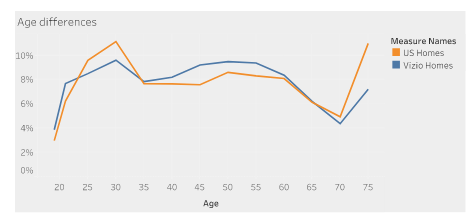
When we compared the distribution of the ages present in Experian homes with those in VIZIO homes, we see a good correlation (R2 = 0.97) but with significant variation in the over-75 age category.
Household income Estimates
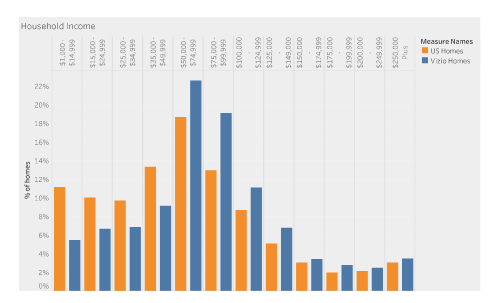
Household income correlates less (R2 = 0.89), with the Inscape population significantly wealthier than the Experian universe. Those with a household income of less than $50K are significantly less likely to be represented in Inscape data than in the Experian database.
Ethnicity
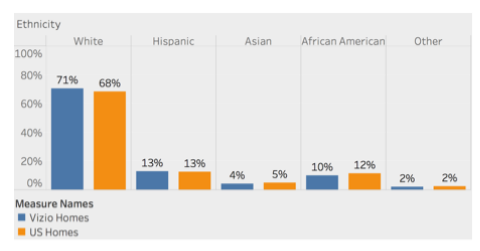
Ethnicity correlates strongly between the two populations (R2 = 0.999), and the Inscape TV population strongly mirrors the ethnic makeup of the Experian database.
The smarter way to stay on top of broadcasting and cable industry. Sign up below
Education
Education correlates (R2 = 0.98), skewing towards a higher education level than the country as a whole. The biggest skews are against those with a high-school education or less.
Home Ownership
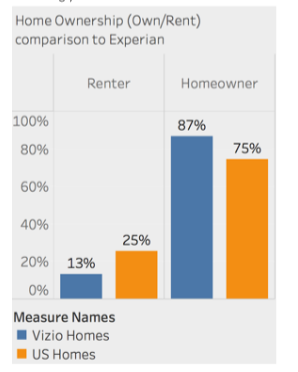
Home ownership correlates at (R2 = 0.97), but non-homeowners are significantly underrepresented in the Inscape data. Care should be taken when targeting or measuring groups who do not own their own home without calibrating data accordingly.
Marital Status
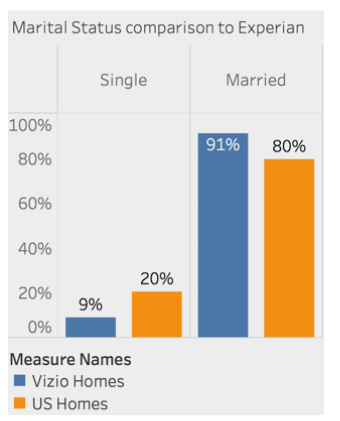
Marital status correlates better than home ownership (R2 = 0.98), but single individuals are still underrepresented. Calibration in this category is relatively easy.
Geographic distributions
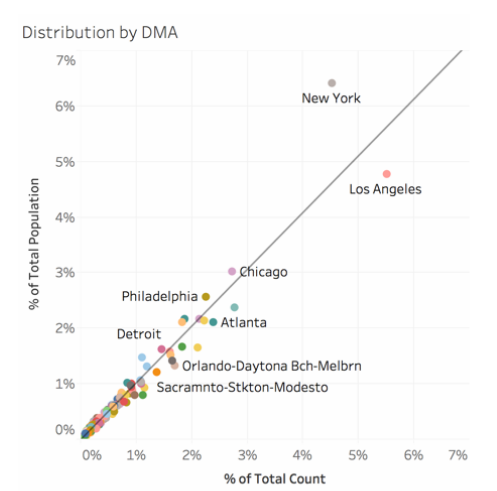
Nielsen publishes the number of households in each DMA annually. Inscape provides the DMA for each TV in their dataset derived from geolocation data based on both IP geolocation and WiFi geolocation. In this analysis, we have grouped TVs in the same household by IP address, applying a filter to remove commercial facilities, military bases and VPN endpoints that report larger-than-expected numbers of TVs.
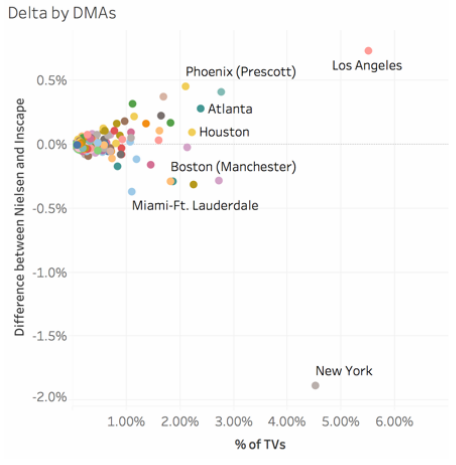
We generally see a correlation (R2 = 0.94) between the expected Nielsen number of TVs and the number of Inscape TVs in each DMA. However, the variance from the expected Nielsen number is high for many DMAs:
The absolute number of TVs in each DMA varies from 580 in Glendive to 1.1 million in Los Angeles. The sampling error of 1 percent varies from 0.02 percent in larger DMAs to 0.75 percent in Glendive. We conclude that the Inscape dataset has a statistically significant number of TVs for measurement down to 1-percent accuracy in all DMAs.
Conclusions
The Inscape dataset provides broad national coverage of TV viewing. It provides coverage down to 1 percent granularity in all DMAs and significantly lower granularity in the largest DMAs.
The Inscape data set has good representation against most Experian attributes, although advertisers looking to target low income consumers, seniors, or individuals who do not own their own home, may want to augment data here with other datasets to ensure a representative sample.
For measurement purposes, the dataset should be calibrated for geographical variations. More precise results will come from weighting the population to account for variations in household income and home ownership.
